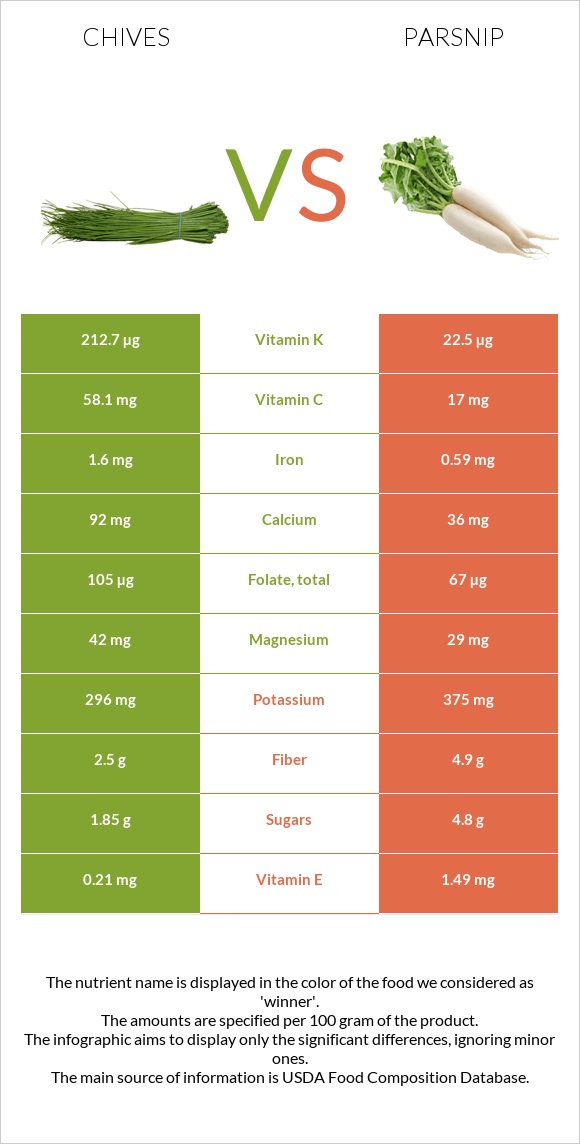
The main differences between chives and parsnip Chives are richer in vitamin K, vitamin A, vitamin C, iron, folate, and calcium, yet parsnip is richer in fiber, vitamin E, manganese, and vitamin B5. Daily need coverage for vitamin K for chives is 159% higher. Chives have a lower glycemic index than parsnip. Food types used in this article are Chives, raw and Parsnips, raw .
Infographic
Mineral Comparison
Mineral comparison score is based on the number of minerals by which one or the other food is richer. The "coverage" charts below show how much of the daily needs can be covered by 300 grams of the food.
5
100 g
300 g
1 tsp chopped - 1g 1 tbsp chopped - 3g
Magnesium
Magnesium
Calcium
Calcium
Potassium
Potassium
Iron
Iron
Copper
Copper
Zinc
Zinc
Phosphorus
Phosphorus
Sodium
Sodium
Manganese
Manganese
Selenium
Selenium
30%
28%
26%
60%
52%
15%
25%
0.39%
49%
4.9%
4
100 g
300 g
1 cup slices - 133g
Magnesium
Magnesium
Calcium
Calcium
Potassium
Potassium
Iron
Iron
Copper
Copper
Zinc
Zinc
Phosphorus
Phosphorus
Sodium
Sodium
Manganese
Manganese
Selenium
Selenium
21%
11%
33%
22%
40%
16%
30%
1.3%
73%
9.8%
Vitamin Comparison
Vitamin comparison score is based on the number of vitamins by which one or the other food is richer. The "coverage" charts below show how much of the daily needs can be covered by 300 grams of the food.
6
100 g
300 g
1 tsp chopped - 1g 1 tbsp chopped - 3g
Vitamin C
Vit. C
Vitamin D
Vit. D
Vitamin A
Vit. A
Vitamin E
Vit. E
Vitamin B1
Vit. B1
Vitamin B2
Vit. B2
Vitamin B3
Vit. B3
Vitamin B5
Vit. B5
Vitamin B6
Vit. B6
Vitamin B12
Vit. B12
Vitamin K
Vit. K
Folate
Folate
194%
0%
73%
4.2%
20%
27%
12%
19%
32%
0%
532%
79%
3
100 g
300 g
1 cup slices - 133g
Vitamin C
Vit. C
Vitamin D
Vit. D
Vitamin A
Vit. A
Vitamin E
Vit. E
Vitamin B1
Vit. B1
Vitamin B2
Vit. B2
Vitamin B3
Vit. B3
Vitamin B5
Vit. B5
Vitamin B6
Vit. B6
Vitamin B12
Vit. B12
Vitamin K
Vit. K
Folate
Folate
57%
0%
0%
30%
23%
12%
13%
36%
21%
0%
56%
50%
All nutrients comparison - raw data values
Nutrient
DV% diff.
Vitamin K
212.7µg
22.5µg
159%
Vitamin C
58.1mg
17mg
46%
Vitamin A
218µg
0µg
24%
Iron
1.6mg
0.59mg
13%
Fiber
2.5g
4.9g
10%
Folate
105µg
67µg
10%
Vitamin E
0.21mg
1.49mg
9%
Manganese
0.373mg
0.56mg
8%
Calcium
92mg
36mg
6%
Vitamin B5
0.324mg
0.6mg
6%
Carbs
4.35g
17.99g
5%
Vitamin B2
0.115mg
0.05mg
5%
Protein
3.27g
1.2g
4%
Copper
0.157mg
0.12mg
4%
Vitamin B6
0.138mg
0.09mg
4%
Magnesium
42mg
29mg
3%
Calories
30kcal
75kcal
2%
Potassium
296mg
375mg
2%
Phosphorus
58mg
71mg
2%
Selenium
0.9µg
1.8µg
2%
Fats
0.73g
0.3g
1%
Vitamin B1
0.078mg
0.09mg
1%
Choline
5.2mg
1%
Polyunsaturated fat
0.267g
0.047g
1%
Protein per 100 calories
11g
1.6g
N/A
Calories per 10 g protein
92kcal
625kcal
N/A
Weight per 100 calories
333g
133g
N/A
Net carbs
1.85g
13.09g
N/A
Sugar
1.85g
4.8g
N/A
Zinc
0.56mg
0.59mg
0%
Sodium
3mg
10mg
0%
Vitamin B3
0.647mg
0.7mg
0%
Saturated fat
0.146g
0.05g
0%
Monounsaturated fat
0.095g
0.112g
0%
Tryptophan
0.037mg
0%
Threonine
0.128mg
0%
Isoleucine
0.139mg
0%
Leucine
0.195mg
0%
Lysine
0.163mg
0%
Methionine
0.036mg
0%
Phenylalanine
0.105mg
0%
Valine
0.145mg
0%
Histidine
0.057mg
0%
Macronutrient Comparison
Macronutrient breakdown side-by-side comparison
4
3%
4%
91%
Protein:
3.27 g
Fats:
0.73 g
Carbs:
4.35 g
Water:
90.65 g
Other:
1 g
1
18%
80%
Protein:
1.2 g
Fats:
0.3 g
Carbs:
17.99 g
Water:
79.53 g
Other:
0.98 g
Contains
more
Protein Protein
+172.5%
Contains
more
Fats Fats
+143.3%
Contains
more
Water Water
+14%
Contains
more
Carbs Carbs
+313.6%
Fat Type Comparison
Fat type breakdown side-by-side comparison
1
29%
19%
53%
Saturated fat:
Sat. Fat
0.146 g
Monounsaturated fat:
Mono. Fat
0.095 g
Polyunsaturated fat:
Poly. Fat
0.267 g
2
24%
54%
22%
Saturated fat:
Sat. Fat
0.05 g
Monounsaturated fat:
Mono. Fat
0.112 g
Polyunsaturated fat:
Poly. Fat
0.047 g
Contains
more
Poly. Fat Polyunsaturated fat
+468.1%
Contains
less
Sat. Fat Saturated fat
-65.8%
Contains
more
Mono. Fat Monounsaturated fat
+17.9%