Chives vs. Onion — Health Impact and Nutrition Comparison


Summary
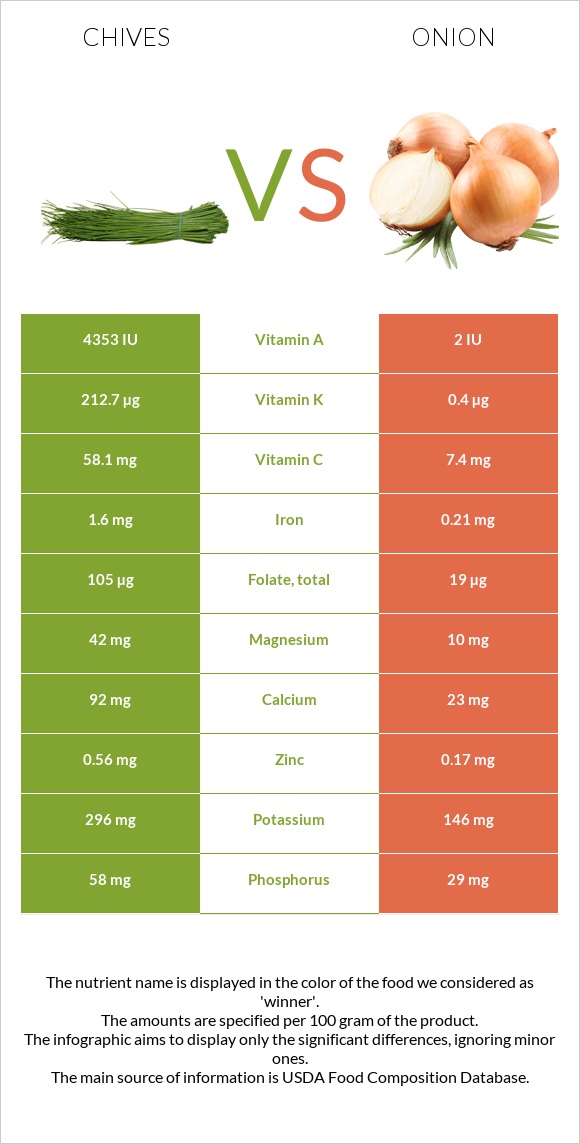
Chives are higher in vitamin C and copper. They are more than eight times higher in vitamin C. Onions provide two times more carbs than Chives. Onions are also lower in proteins.
Introduction
This article will compare Chives and Onion, focusing on their nutritional content and health impact. Here we will discuss the differences between raw chives (1) and raw onion (2).
Macronutrients
Although Onion and Chives contain more than 90% water, the distribution of macronutrients differs. The amounts of the nutrients they give are compared below.
Calories
Chives and Onions are low-calorie foods because they are vegetables. However, Onion is higher in calories than Chives: it provides ten calories more.
Carbs
Both Onion and Chives are low in carbs. However, in terms of carbs, Onion is more than two times higher compared to Chives.
Chives are lower in net carbs: 100g has 1.9g of net carbs, while the same amount of Onion contains 7.6g.
Fiber
Chives are higher in fiber than Onion. They provide 2.5g of fiber per 100g. Chives are significantly richer in soluble fiber.
Protein
Chives and Onion are plant food products. Hence, they do not provide much protein. Still, Chives are three times higher in proteins than Onion.
Vitamins
Both Onion and Chives are rich in different vitamins, but in general, Chives are higher in vitamins.
Chives are an excellent source of vitamin C, A, and K: they are more than eight times higher in vitamin C (58.1mg per 100g) than Onions (7.4mg per 100g).
You can check the vitamin composition of these foods in the chart below.
Vitamin Comparison
| Contains more Vitamin CVitamin C | +685.1% |
| Contains more Vitamin AVitamin A | +∞% |
| Contains more Vitamin EVitamin E | +950% |
| Contains more Vitamin B1Vitamin B1 | +69.6% |
| Contains more Vitamin B2Vitamin B2 | +325.9% |
| Contains more Vitamin B3Vitamin B3 | +457.8% |
| Contains more Vitamin B5Vitamin B5 | +163.4% |
| Contains more Vitamin B6Vitamin B6 | +15% |
| Contains more Vitamin KVitamin K | +53075% |
| Contains more FolateFolate | +452.6% |
Minerals
Chives are the champions in this section. They are higher in calcium, iron, potassium, magnesium, phosphorus, zinc, and copper.
Chives are approximately five times higher in copper than Onion.
You can check these two vegetables' mineral compositions in the chart below.
Mineral Comparison
| Contains more MagnesiumMagnesium | +320% |
| Contains more CalciumCalcium | +300% |
| Contains more PotassiumPotassium | +102.7% |
| Contains more IronIron | +661.9% |
| Contains more CopperCopper | +302.6% |
| Contains more ZincZinc | +229.4% |
| Contains more PhosphorusPhosphorus | +100% |
| Contains less SodiumSodium | -25% |
| Contains more ManganeseManganese | +189.1% |
| Contains more SeleniumSelenium | +80% |
Health impact
Anticancer protection
The anticancer properties of Onions and Chives are mostly linked with sulfur-containing compounds. For instance, Onion provides onionin A, a sulfur-containing chemical that decreases tumor development and inhibits the spread of lung and ovarian cancers (3) (4).
Bone health
Onions and Chieves can help boost bone health.
Onions reduce oxidative stress and decrease bone loss, thus preventing osteoporosis and improving bone density (5). Chives boost bone health by their vitamin K content because vitamin K supplements prevent osteoporosis.
References

Infographic
All nutrients comparison - raw data values
| Nutrient | |
|
DV% diff. |
| Vitamin K | 212.7µg | 0.4µg | 177% |
| Vitamin C | 58.1mg | 7.4mg | 56% |
| Vitamin A | 218µg | 0µg | 24% |
| Folate | 105µg | 19µg | 22% |
| Iron | 1.6mg | 0.21mg | 17% |
| Copper | 0.157mg | 0.039mg | 13% |
| Manganese | 0.373mg | 0.129mg | 11% |
| Magnesium | 42mg | 10mg | 8% |
| Calcium | 92mg | 23mg | 7% |
| Vitamin B2 | 0.115mg | 0.027mg | 7% |
| Protein | 3.27g | 1.1g | 4% |
| Potassium | 296mg | 146mg | 4% |
| Zinc | 0.56mg | 0.17mg | 4% |
| Phosphorus | 58mg | 29mg | 4% |
| Vitamin B5 | 0.324mg | 0.123mg | 4% |
| Fiber | 2.5g | 1.7g | 3% |
| Vitamin B1 | 0.078mg | 0.046mg | 3% |
| Vitamin B3 | 0.647mg | 0.116mg | 3% |
| Carbs | 4.35g | 9.34g | 2% |
| Polyunsaturated fat | 0.267g | 0.017g | 2% |
| Fructose | 1.29g | 2% | |
| Calories | 30kcal | 40kcal | 1% |
| Fats | 0.73g | 0.1g | 1% |
| Vitamin E | 0.21mg | 0.02mg | 1% |
| Selenium | 0.9µg | 0.5µg | 1% |
| Vitamin B6 | 0.138mg | 0.12mg | 1% |
| Protein per 100 calories | 11g | 2.8g | N/A |
| Calories per 10 g protein | 92kcal | 364kcal | N/A |
| Weight per 100 calories | 333g | 250g | N/A |
| Net carbs | 1.85g | 7.64g | N/A |
| Sugar | 1.85g | 4.24g | N/A |
| Sodium | 3mg | 4mg | 0% |
| Choline | 5.2mg | 6.1mg | 0% |
| Saturated fat | 0.146g | 0.042g | 0% |
| Monounsaturated fat | 0.095g | 0.013g | 0% |
| Tryptophan | 0.037mg | 0.014mg | 0% |
| Threonine | 0.128mg | 0.021mg | 0% |
| Isoleucine | 0.139mg | 0.014mg | 0% |
| Leucine | 0.195mg | 0.025mg | 0% |
| Lysine | 0.163mg | 0.039mg | 0% |
| Methionine | 0.036mg | 0.002mg | 0% |
| Phenylalanine | 0.105mg | 0.025mg | 0% |
| Valine | 0.145mg | 0.021mg | 0% |
| Histidine | 0.057mg | 0.014mg | 0% |
Macronutrient Comparison
| Contains more ProteinProtein | +197.3% |
| Contains more FatsFats | +630% |
| Contains more OtherOther | +185.7% |
| Contains more CarbsCarbs | +114.7% |
Fat Type Comparison
| Contains more Mono. FatMonounsaturated fat | +630.8% |
| Contains more Poly. FatPolyunsaturated fat | +1470.6% |
| Contains less Sat. FatSaturated fat | -71.2% |
People also compare


References
All the values for which the sources are not specified explicitly are taken from FDA’s Food Central. The exact link to the food presented on this page can be found below.
- Chives - https://fdc.nal.usda.gov/fdc-app.html#/food-details/169994/nutrients
- Onion - https://fdc.nal.usda.gov/fdc-app.html#/food-details/170000/nutrients
All the Daily Values are presented for males aged 31-50, for 2000-calorie diets.