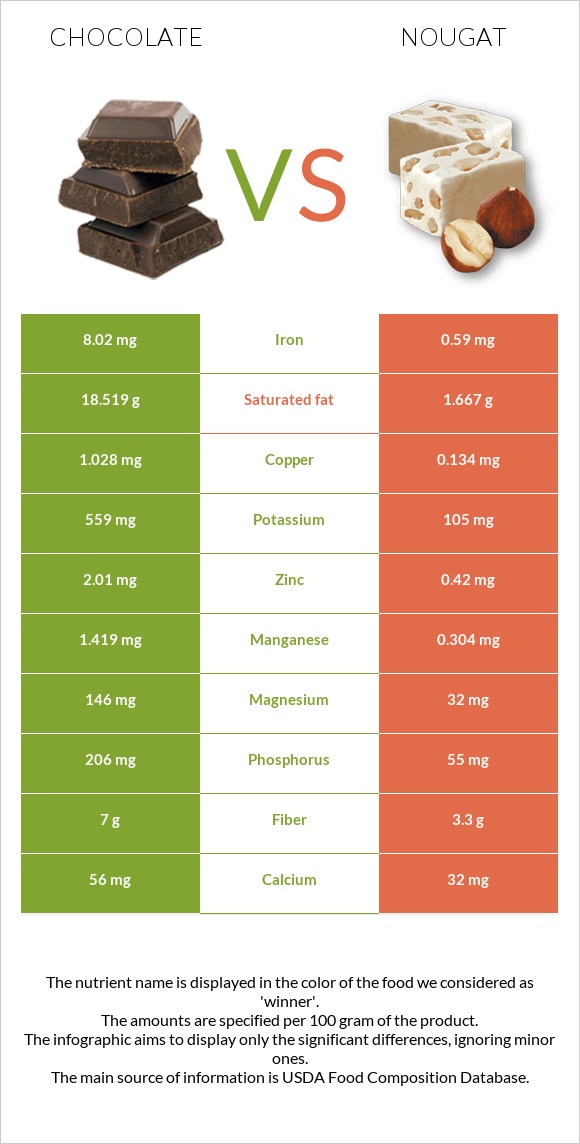
How are chocolate and nougat different? Chocolate is richer in copper, iron, manganese, magnesium, phosphorus, fiber, zinc, and potassium, while nougat is higher in vitamin E. Chocolate covers your daily need for copper, 99% more than nougat. Chocolate contains 14 times more iron than nougat. Chocolate contains 8.02mg of iron, while nougat contains 0.59mg. Nougat is lower in saturated fat. Chocolate, dark, 45- 59% cacao solids and Candies, nougat, with almonds types were used in this article.
Infographic
Mineral Comparison
Mineral comparison score is based on the number of minerals by which one or the other food is richer. The "coverage" charts below show how much of the daily needs can be covered by 300 grams of the food.
10
100 g
300 g
1 oz - 28.35g 1 bar - 162g
Magnesium
Magnesium
Calcium
Calcium
Potassium
Potassium
Iron
Iron
Copper
Copper
Zinc
Zinc
Phosphorus
Phosphorus
Sodium
Sodium
Manganese
Manganese
Selenium
Selenium
104%
17%
49%
301%
343%
55%
88%
3.1%
185%
16%
0
100 g
300 g
1 piece - 14g
Magnesium
Magnesium
Calcium
Calcium
Potassium
Potassium
Iron
Iron
Copper
Copper
Zinc
Zinc
Phosphorus
Phosphorus
Sodium
Sodium
Manganese
Manganese
Selenium
Selenium
23%
9.6%
9.3%
22%
45%
11%
24%
4.3%
40%
14%
Vitamin Comparison
Vitamin comparison score is based on the number of vitamins by which one or the other food is richer. The "coverage" charts below show how much of the daily needs can be covered by 300 grams of the food.
7
100 g
300 g
1 oz - 28.35g 1 bar - 162g
Vitamin C
Vit. C
Vitamin D
Vit. D
Vitamin A
Vit. A
Vitamin E
Vit. E
Vitamin B1
Vit. B1
Vitamin B2
Vit. B2
Vitamin B3
Vit. B3
Vitamin B5
Vit. B5
Vitamin B6
Vit. B6
Vitamin B12
Vit. B12
Vitamin K
Vit. K
Folate
Folate
0%
0%
0.67%
11%
6.3%
12%
14%
18%
9.7%
29%
20%
0%
4
100 g
300 g
1 piece - 14g
Vitamin C
Vit. C
Vitamin D
Vit. D
Vitamin A
Vit. A
Vitamin E
Vit. E
Vitamin B1
Vit. B1
Vitamin B2
Vit. B2
Vitamin B3
Vit. B3
Vitamin B5
Vit. B5
Vitamin B6
Vit. B6
Vitamin B12
Vit. B12
Vitamin K
Vit. K
Folate
Folate
1%
0%
0%
55%
3.3%
34%
9%
3.6%
4.6%
1.3%
0%
3.8%
All nutrients comparison - raw data values
Nutrient
DV% diff.
Copper
1.028mg
0.134mg
99%
Iron
8.02mg
0.59mg
93%
Saturated fat
18.519g
1.667g
77%
Manganese
1.419mg
0.304mg
48%
Fats
31.28g
1.67g
46%
Magnesium
146mg
32mg
27%
Monounsaturated fat
9.54g
0g
24%
Phosphorus
206mg
55mg
22%
Fiber
7g
3.3g
15%
Vitamin E
0.54mg
2.77mg
15%
Zinc
2.01mg
0.42mg
14%
Potassium
559mg
105mg
13%
Caffeine
43mg
0mg
11%
Carbs
61.17g
92.39g
10%
Vitamin B12
0.23µg
0.01µg
9%
Vitamin B2
0.05mg
0.148mg
8%
Calories
546kcal
398kcal
7%
Vitamin K
8.1µg
0µg
7%
Polyunsaturated fat
1.092g
0g
7%
Vitamin B5
0.297mg
0.06mg
5%
Protein
4.88g
3.33g
3%
Cholesterol
8mg
0mg
3%
Calcium
56mg
32mg
2%
Vitamin B3
0.725mg
0.478mg
2%
Vitamin B6
0.042mg
0.02mg
2%
Selenium
3µg
2.6µg
1%
Vitamin B1
0.025mg
0.013mg
1%
Folate
5µg
1%
Choline
5.1mg
1%
Weight per 100 calories
18g
25g
N/A
Unsaturated / Saturated Fat ratio
0.57
0
N/A
Vitamin C
0.3mg
0%
Net carbs
54.17g
89.09g
N/A
Sugar
47.9g
44.97g
N/A
Sodium
24mg
33mg
0%
Vitamin A
2µg
0µg
0%
Trans fat
0.112g
N/A
Omega-3 - EPA
0.001g
0g
N/A
Omega-3 - ALA
0.085g
N/A
Omega-6 - Eicosadienoic acid
0.001g
0g
N/A
Omega-6 - Linoleic acid
0.947g
N/A
Macronutrient Comparison
Macronutrient breakdown side-by-side comparison
3
5%
31%
61%
2%
Protein:
4.88 g
Fats:
31.28 g
Carbs:
61.17 g
Water:
0.97 g
Other:
1.7 g
2
3%
2%
92%
2%
Protein:
3.33 g
Fats:
1.67 g
Carbs:
92.39 g
Water:
2.15 g
Other:
0.46 g
Contains
more
Protein Protein
+46.5%
Contains
more
Fats Fats
+1773.1%
Contains
more
Other Other
+269.6%
Contains
more
Carbs Carbs
+51%
Contains
more
Water Water
+121.6%
Fat Type Comparison
Fat type breakdown side-by-side comparison
2
64%
33%
4%
Saturated fat:
Sat. Fat
18.519 g
Monounsaturated fat:
Mono. Fat
9.54 g
Polyunsaturated fat:
Poly. Fat
1.092 g
1
100%
Saturated fat:
Sat. Fat
1.667 g
Monounsaturated fat:
Mono. Fat
0 g
Polyunsaturated fat:
Poly. Fat
0 g
Contains
more
Mono. Fat Monounsaturated fat
+∞%
Contains
more
Poly. Fat Polyunsaturated fat
+∞%
Contains
less
Sat. Fat Saturated fat
-91%