Cocoa, dry powder, hi-fat or breakfast, processed with alkali vs. Cocoa, dry powder, hi-fat or breakfast, plain — In-Depth Nutrition Comparison
Compare
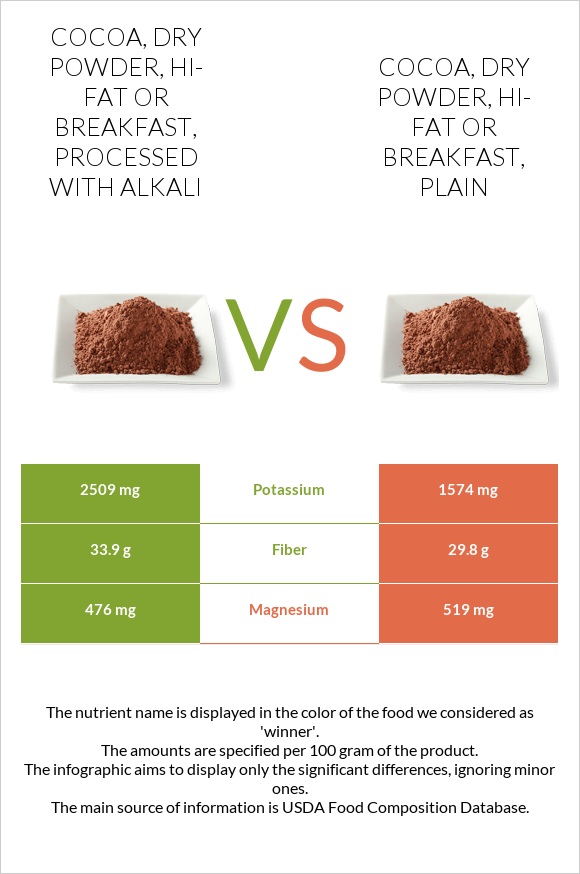
How are cocoa, dry powder, hi-fat or breakfast, processed with alkali and cocoa, dry powder, hi-fat or breakfast, plain different?
- Cocoa, dry powder, hi-fat or breakfast, processed with alkali is higher in potassium and fiber; however, cocoa, dry powder, hi-fat or breakfast, plain is richer in magnesium.
- Daily need coverage for potassium for cocoa, dry powder, hi-fat or breakfast, processed with alkali is 27% higher.
Cocoa, dry powder, hi-fat or breakfast, processed with alkali and Cocoa, dry powder, hi-fat or breakfast, plain are the varieties used in this article.
Infographic
Infographic link
Mineral Comparison
Mineral comparison score is based on the number of minerals by which one or the other food is richer. The "coverage" charts below show how much of the daily needs can be covered by 300 grams of the food.
| Contains more PotassiumPotassium | +59.4% |
Vitamin Comparison
Vitamin comparison score is based on the number of vitamins by which one or the other food is richer. The "coverage" charts below show how much of the daily needs can be covered by 300 grams of the food.
| Contains more Vitamin EVitamin E | +100% |
| Contains more Vitamin KVitamin K | +91.3% |
All nutrients comparison - raw data values
| Nutrient |  |
|
DV% diff. |
| Caffeine | 72mg | 197mg | 31% |
| Potassium | 2509mg | 1574mg | 28% |
| Fiber | 33.9g | 29.8g | 16% |
| Magnesium | 476mg | 519mg | 10% |
| Vitamin K | 4.4µg | 2.3µg | 2% |
| Carbs | 49.71g | 51.39g | 1% |
| Vitamin E | 0.18mg | 0.09mg | 1% |
| Calories | 479kcal | 486kcal | 0% |
| Protein | 16.8g | 16.8g | 0% |
| Protein per 100 calories | 3.5g | 3.5g | N/A |
| Calories per 10 g protein | 285kcal | 289kcal | N/A |
| Weight per 100 calories | 21g | 21g | N/A |
| Fats | 23.71g | 23.71g | 0% |
| Unsaturated / Saturated Fat ratio | 0.64 | 0.64 | N/A |
| Net carbs | 15.81g | 21.59g | N/A |
| Calcium | 122mg | 122mg | 0% |
| Iron | 14.5mg | 14.5mg | 0% |
| Sugar | 1.53g | 1.55g | N/A |
| Copper | 3.61mg | 3.61mg | 0% |
| Zinc | 6.7mg | 6.7mg | 0% |
| Phosphorus | 758mg | 758mg | 0% |
| Sodium | 20mg | 20mg | 0% |
| Selenium | 12.3µg | 12.3µg | 0% |
| Vitamin B1 | 0.08mg | 0.08mg | 0% |
| Vitamin B2 | 0.37mg | 0.37mg | 0% |
| Vitamin B3 | 1.8mg | 1.8mg | 0% |
| Vitamin B6 | 0.19mg | 0.19mg | 0% |
| Folate | 38µg | 38µg | 0% |
| Choline | 11.4mg | 11.9mg | 0% |
| Saturated fat | 12.64g | 12.64g | 0% |
| Monounsaturated fat | 7.38g | 7.38g | 0% |
| Polyunsaturated fat | 0.769g | 0.769g | 0% |
Macronutrient Comparison
Macronutrient breakdown side-by-side comparison
Protein:
16.8 g
Fats:
23.71 g
Carbs:
49.71 g
Water:
3 g
Other:
6.78 g
Protein:
16.8 g
Fats:
23.71 g
Carbs:
51.39 g
Water:
3 g
Other:
5.1 g
| Contains more OtherOther | +32.9% |
~equal in
Protein
~16.8g
~equal in
Fats
~23.71g
~equal in
Carbs
~51.39g
~equal in
Water
~3g
Fat Type Comparison
Fat type breakdown side-by-side comparison
Saturated fat:
Sat. Fat
12.64 g
Monounsaturated fat:
Mono. Fat
7.38 g
Polyunsaturated fat:
Poly. Fat
0.769 g
Saturated fat:
Sat. Fat
12.64 g
Monounsaturated fat:
Mono. Fat
7.38 g
Polyunsaturated fat:
Poly. Fat
0.769 g
~equal in
Saturated fat
~12.64g
~equal in
Monounsaturated fat
~7.38g
~equal in
Polyunsaturated fat
~0.769g