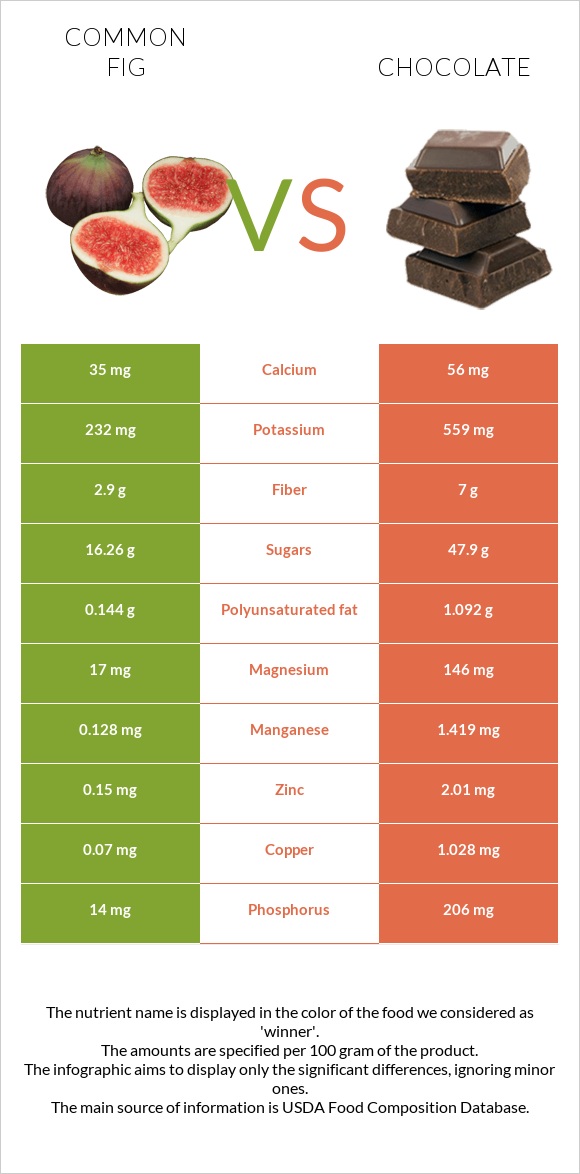
Differences between figs and chocolate Figs contain less copper, iron, manganese, magnesium, phosphorus, zinc, fiber, potassium, and vitamin B12 than chocolate. Chocolate's daily need coverage for copper is 106% higher. The amount of saturated fat in figs is lower. Chocolate has a lower glycemic index. The glycemic index of chocolate is 23, while the glycemic index of figs is 61. The food types used in this comparison are Figs, raw and Chocolate, dark, 45- 59% cacao solids .
Infographic
Mineral Comparison
Mineral comparison score is based on the number of minerals by which one or the other food is richer. The "coverage" charts below show how much of the daily needs can be covered by 300 grams of the food.
1
100 g
300 g
1 small (1-1/2" dia) - 40g 1 medium (2-1/4" dia) - 50g 1 large (2-1/2" dia) - 64g
Magnesium
Magnesium
Calcium
Calcium
Potassium
Potassium
Iron
Iron
Copper
Copper
Zinc
Zinc
Phosphorus
Phosphorus
Sodium
Sodium
Manganese
Manganese
Selenium
Selenium
12%
11%
20%
14%
23%
4.1%
6%
0.13%
17%
1.1%
9
100 g
300 g
1 oz - 28.35g 1 bar - 162g
Magnesium
Magnesium
Calcium
Calcium
Potassium
Potassium
Iron
Iron
Copper
Copper
Zinc
Zinc
Phosphorus
Phosphorus
Sodium
Sodium
Manganese
Manganese
Selenium
Selenium
104%
17%
49%
301%
343%
55%
88%
3.1%
185%
16%
Vitamin Comparison
Vitamin comparison score is based on the number of vitamins by which one or the other food is richer. The "coverage" charts below show how much of the daily needs can be covered by 300 grams of the food.
5
100 g
300 g
1 small (1-1/2" dia) - 40g 1 medium (2-1/4" dia) - 50g 1 large (2-1/2" dia) - 64g
Vitamin C
Vit. C
Vitamin D
Vit. D
Vitamin A
Vit. A
Vitamin E
Vit. E
Vitamin B1
Vit. B1
Vitamin B2
Vit. B2
Vitamin B3
Vit. B3
Vitamin B5
Vit. B5
Vitamin B6
Vit. B6
Vitamin B12
Vit. B12
Vitamin K
Vit. K
Folate
Folate
6.7%
0%
2.3%
2.2%
15%
12%
7.5%
18%
26%
0%
12%
4.5%
4
100 g
300 g
1 oz - 28.35g 1 bar - 162g
Vitamin C
Vit. C
Vitamin D
Vit. D
Vitamin A
Vit. A
Vitamin E
Vit. E
Vitamin B1
Vit. B1
Vitamin B2
Vit. B2
Vitamin B3
Vit. B3
Vitamin B5
Vit. B5
Vitamin B6
Vit. B6
Vitamin B12
Vit. B12
Vitamin K
Vit. K
Folate
Folate
0%
0%
0.67%
11%
6.3%
12%
14%
18%
9.7%
29%
20%
0%
All nutrients comparison - raw data values
Nutrient
DV% diff.
Copper
0.07mg
1.028mg
106%
Iron
0.37mg
8.02mg
96%
Saturated fat
0.06g
18.519g
84%
Manganese
0.128mg
1.419mg
56%
Fats
0.3g
31.28g
48%
Magnesium
17mg
146mg
31%
Phosphorus
14mg
206mg
27%
Calories
74kcal
546kcal
24%
Monounsaturated fat
0.066g
9.54g
24%
Zinc
0.15mg
2.01mg
17%
Fiber
2.9g
7g
16%
Carbs
19.18g
61.17g
14%
Caffeine
0mg
43mg
11%
Potassium
232mg
559mg
10%
Vitamin B12
0µg
0.23µg
10%
Protein
0.75g
4.88g
8%
Polyunsaturated fat
0.144g
1.092g
6%
Selenium
0.2µg
3µg
5%
Vitamin B6
0.113mg
0.042mg
5%
Cholesterol
0mg
8mg
3%
Vitamin E
0.11mg
0.54mg
3%
Vitamin B1
0.06mg
0.025mg
3%
Vitamin K
4.7µg
8.1µg
3%
Vitamin C
2mg
2%
Calcium
35mg
56mg
2%
Vitamin B3
0.4mg
0.725mg
2%
Folate
6µg
2%
Sodium
1mg
24mg
1%
Vitamin A
7µg
2µg
1%
Choline
4.7mg
1%
Protein per 100 calories
1g
0.89g
N/A
Calories per 10 g protein
987kcal
1119kcal
N/A
Weight per 100 calories
135g
18g
N/A
Unsaturated / Saturated Fat ratio
3.5
0.57
N/A
Net carbs
16.28g
54.17g
N/A
Sugar
16.26g
47.9g
N/A
Vitamin B2
0.05mg
0.05mg
0%
Vitamin B5
0.3mg
0.297mg
0%
Trans fat
0g
0.112g
N/A
Tryptophan
0.006mg
0%
Threonine
0.024mg
0%
Isoleucine
0.023mg
0%
Leucine
0.033mg
0%
Lysine
0.03mg
0%
Methionine
0.006mg
0%
Phenylalanine
0.018mg
0%
Valine
0.028mg
0%
Histidine
0.011mg
0%
Omega-3 - EPA
0g
0.001g
N/A
Omega-3 - ALA
0.085g
N/A
Omega-6 - Eicosadienoic acid
0.001g
N/A
Omega-6 - Linoleic acid
0.947g
N/A
Macronutrient Comparison
Macronutrient breakdown side-by-side comparison
1
19%
79%
Protein:
0.75 g
Fats:
0.3 g
Carbs:
19.18 g
Water:
79.11 g
Other:
0.66 g
4
5%
31%
61%
2%
Protein:
4.88 g
Fats:
31.28 g
Carbs:
61.17 g
Water:
0.97 g
Other:
1.7 g
Contains
more
Water Water
+8055.7%
Contains
more
Protein Protein
+550.7%
Contains
more
Fats Fats
+10326.7%
Contains
more
Carbs Carbs
+218.9%
Contains
more
Other Other
+157.6%
Fat Type Comparison
Fat type breakdown side-by-side comparison
1
22%
24%
53%
Saturated fat:
Sat. Fat
0.06 g
Monounsaturated fat:
Mono. Fat
0.066 g
Polyunsaturated fat:
Poly. Fat
0.144 g
2
64%
33%
4%
Saturated fat:
Sat. Fat
18.519 g
Monounsaturated fat:
Mono. Fat
9.54 g
Polyunsaturated fat:
Poly. Fat
1.092 g
Contains
less
Sat. Fat Saturated fat
-99.7%
Contains
more
Mono. Fat Monounsaturated fat
+14354.5%
Contains
more
Poly. Fat Polyunsaturated fat
+658.3%