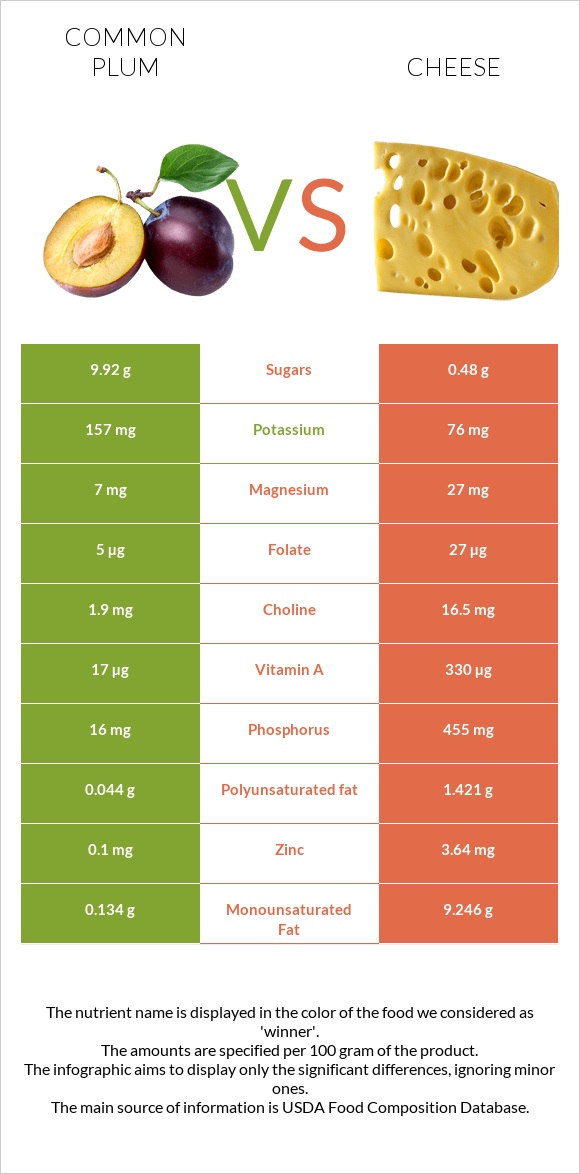
How are plums and cheese different? Plums contain less calcium, phosphorus, selenium, vitamin B12, zinc, vitamin B2, and vitamin A than cheese. Cheese covers your daily need for saturated fat, 94% more than plums. Plums contain less saturated fat. Plums have a higher glycemic index. The glycemic index of plums is 53, while the glycemic index of cheese is 0. Plums, raw and Cheese, cheddar types were used in this article.
Infographic
Mineral Comparison
Mineral comparison score is based on the number of minerals by which one or the other food is richer. The "coverage" charts below show how much of the daily needs can be covered by 300 grams of the food.
5
100 g
300 g
1 fruit (2-1/8" dia) - 66g 1 NLEA serving - 151g 1 cup, sliced - 165g
Magnesium
Magnesium
Calcium
Calcium
Potassium
Potassium
Iron
Iron
Copper
Copper
Zinc
Zinc
Phosphorus
Phosphorus
Sodium
Sodium
Manganese
Manganese
Selenium
Selenium
5%
1.8%
14%
6.4%
19%
2.7%
6.9%
0%
6.8%
0%
5
100 g
300 g
1 cubic inch - 17g 1 slice (1 oz) - 28g 1 oz - 28.35g 1 cup, shredded - 113g 1 cup, diced - 132g 1 cup, melted - 244g
Magnesium
Magnesium
Calcium
Calcium
Potassium
Potassium
Iron
Iron
Copper
Copper
Zinc
Zinc
Phosphorus
Phosphorus
Sodium
Sodium
Manganese
Manganese
Selenium
Selenium
19%
213%
6.7%
5.3%
10%
99%
195%
85%
3.5%
155%
Vitamin Comparison
Vitamin comparison score is based on the number of vitamins by which one or the other food is richer. The "coverage" charts below show how much of the daily needs can be covered by 300 grams of the food.
3
100 g
300 g
1 fruit (2-1/8" dia) - 66g 1 NLEA serving - 151g 1 cup, sliced - 165g
Vitamin C
Vit. C
Vitamin D
Vit. D
Vitamin A
Vit. A
Vitamin E
Vit. E
Vitamin B1
Vit. B1
Vitamin B2
Vit. B2
Vitamin B3
Vit. B3
Vitamin B5
Vit. B5
Vitamin B6
Vit. B6
Vitamin B12
Vit. B12
Vitamin K
Vit. K
Folate
Folate
32%
0%
5.7%
5.2%
7%
6%
7.8%
8.1%
6.7%
0%
16%
3.8%
8
100 g
300 g
1 cubic inch - 17g 1 slice (1 oz) - 28g 1 oz - 28.35g 1 cup, shredded - 113g 1 cup, diced - 132g 1 cup, melted - 244g
Vitamin C
Vit. C
Vitamin D
Vit. D
Vitamin A
Vit. A
Vitamin E
Vit. E
Vitamin B1
Vit. B1
Vitamin B2
Vit. B2
Vitamin B3
Vit. B3
Vitamin B5
Vit. B5
Vitamin B6
Vit. B6
Vitamin B12
Vit. B12
Vitamin K
Vit. K
Folate
Folate
0%
9%
110%
14%
7.3%
99%
1.1%
25%
15%
138%
6%
20%
All nutrients comparison - raw data values
Nutrient
DV% diff.
Saturated fat
0.017g
18.867g
86%
Calcium
6mg
710mg
70%
Phosphorus
16mg
455mg
63%
Selenium
0µg
28.5µg
52%
Fats
0.28g
33.31g
51%
Vitamin B12
0µg
1.1µg
46%
Protein
0.7g
22.87g
44%
Vitamin A
17µg
330µg
35%
Cholesterol
0mg
99mg
33%
Zinc
0.1mg
3.64mg
32%
Vitamin B2
0.026mg
0.428mg
31%
Sodium
0mg
653mg
28%
Monounsaturated fat
0.134g
9.246g
23%
Calories
46kcal
404kcal
18%
Vitamin C
9.5mg
0mg
11%
Polyunsaturated fat
0.044g
1.421g
9%
Fiber
1.4g
0g
6%
Vitamin B5
0.135mg
0.41mg
6%
Folate
5µg
27µg
6%
Magnesium
7mg
27mg
5%
Fructose
3.07g
0g
4%
Carbs
11.42g
3.09g
3%
Vitamin D*
0 IU
24 IU
3%
Vitamin D
0µg
0.6µg
3%
Copper
0.057mg
0.03mg
3%
Vitamin E
0.26mg
0.71mg
3%
Vitamin B6
0.029mg
0.066mg
3%
Vitamin K
6.4µg
2.4µg
3%
Choline
1.9mg
16.5mg
3%
Potassium
157mg
76mg
2%
Vitamin B3
0.417mg
0.059mg
2%
Manganese
0.052mg
0.027mg
1%
Protein per 100 calories
1.5g
5.7g
N/A
Calories per 10 g protein
657kcal
177kcal
N/A
Weight per 100 calories
217g
25g
N/A
Unsaturated / Saturated Fat ratio
10
0.57
N/A
Net carbs
10.02g
3.09g
N/A
Iron
0.17mg
0.14mg
0%
Sugar
9.92g
0.48g
N/A
Vitamin B1
0.028mg
0.029mg
0%
Trans fat
0g
0.917g
N/A
Tryptophan
0.009mg
0.547mg
0%
Threonine
0.01mg
1.044mg
0%
Isoleucine
0.014mg
1.206mg
0%
Leucine
0.015mg
1.939mg
0%
Lysine
0.016mg
1.025mg
0%
Methionine
0.008mg
0.547mg
0%
Phenylalanine
0.014mg
1.074mg
0%
Valine
0.016mg
1.404mg
0%
Histidine
0.009mg
0.547mg
0%
Omega-3 - EPA
0g
0.01g
N/A
Omega-3 - DHA
0g
0.001g
N/A
Omega-3 - DPA
0g
0.017g
N/A
Omega-6 - Eicosadienoic acid
0.007g
N/A
Macronutrient Comparison
Macronutrient breakdown side-by-side comparison
2
11%
87%
Protein:
0.7 g
Fats:
0.28 g
Carbs:
11.42 g
Water:
87.23 g
Other:
0.37 g
3
23%
33%
3%
37%
4%
Protein:
22.87 g
Fats:
33.31 g
Carbs:
3.09 g
Water:
37.02 g
Other:
3.71 g
Contains
more
Carbs Carbs
+269.6%
Contains
more
Water Water
+135.6%
Contains
more
Protein Protein
+3167.1%
Contains
more
Fats Fats
+11796.4%
Contains
more
Other Other
+902.7%
Fat Type Comparison
Fat type breakdown side-by-side comparison
1
9%
69%
23%
Saturated fat:
Sat. Fat
0.017 g
Monounsaturated fat:
Mono. Fat
0.134 g
Polyunsaturated fat:
Poly. Fat
0.044 g
2
64%
31%
5%
Saturated fat:
Sat. Fat
18.867 g
Monounsaturated fat:
Mono. Fat
9.246 g
Polyunsaturated fat:
Poly. Fat
1.421 g
Contains
less
Sat. Fat Saturated fat
-99.9%
Contains
more
Mono. Fat Monounsaturated fat
+6800%
Contains
more
Poly. Fat Polyunsaturated fat
+3129.5%
Carbohydrate type comparison
Carbohydrate type breakdown side-by-side comparison
5
16%
51%
31%
Starch:
0 g
Sucrose:
1.57 g
Glucose:
5.07 g
Fructose:
3.07 g
Lactose:
0 g
Maltose:
0.08 g
Galactose:
0.14 g
1
54%
25%
21%
Starch:
0 g
Sucrose:
0 g
Glucose:
0.26 g
Fructose:
0 g
Lactose:
0.12 g
Maltose:
0 g
Galactose:
0.1 g
Contains
more
Sucrose Sucrose
+∞%
Contains
more
Glucose Glucose
+1850%
Contains
more
Fructose Fructose
+∞%
Contains
more
Maltose Maltose
+∞%
Contains
more
Galactose Galactose
+40%
Contains
more
Lactose Lactose
+∞%