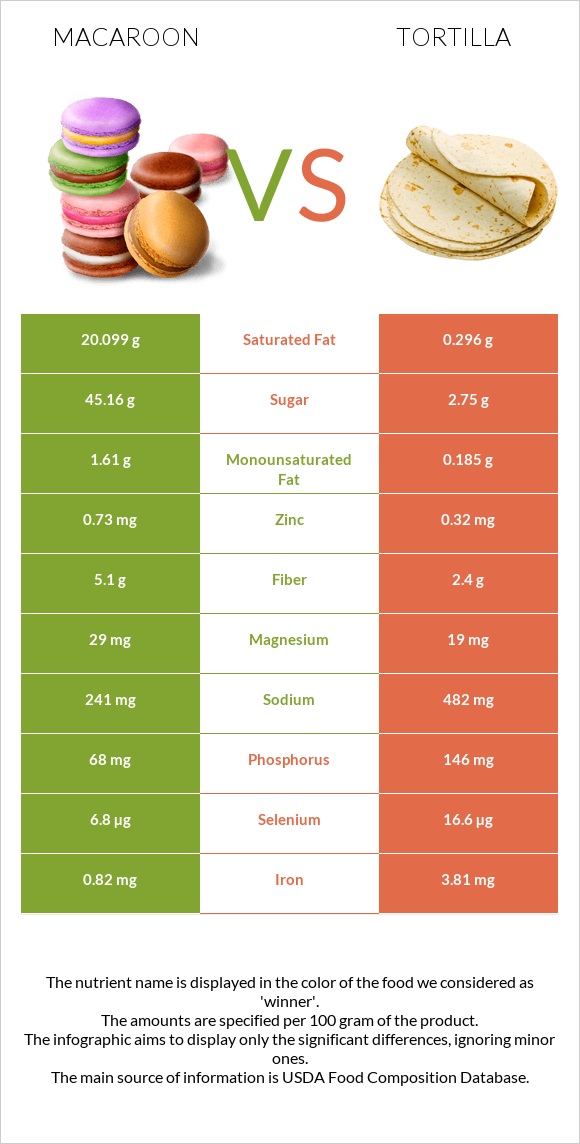
Important differences between macaroon and tortilla Macaroon has more copper and fiber; however, tortilla has more iron, vitamin B1, vitamin B3, folate, selenium, and phosphorus. Macaroon's daily need coverage for saturated fat is 99% more. Macaroon has 3 times more copper than tortilla. Macaroon has 0.269mg of copper, while tortilla has 0.102mg. Tortilla is lower in saturated fat. Tortilla has a higher glycemic index than macaroon. The food varieties used in the comparison are Cookies, coconut macaroon and Tortilla, includes plain, and from mutton sandwich (Navajo) .
Infographic
Mineral Comparison
Mineral comparison score is based on the number of minerals by which one or the other food is richer. The "coverage" charts below show how much of the daily needs can be covered by 300 grams of the food.
5
100 g
300 g
2 cookie 1 serving - 36g
Magnesium
Magnesium
Calcium
Calcium
Potassium
Potassium
Iron
Iron
Copper
Copper
Zinc
Zinc
Phosphorus
Phosphorus
Sodium
Sodium
Manganese
Manganese
Selenium
Selenium
21%
1.5%
11%
31%
90%
20%
29%
31%
0%
37%
5
100 g
300 g
1 serving - 197g
Magnesium
Magnesium
Calcium
Calcium
Potassium
Potassium
Iron
Iron
Copper
Copper
Zinc
Zinc
Phosphorus
Phosphorus
Sodium
Sodium
Manganese
Manganese
Selenium
Selenium
14%
21%
9.3%
143%
34%
8.7%
63%
63%
35%
91%
Vitamin Comparison
Vitamin comparison score is based on the number of vitamins by which one or the other food is richer. The "coverage" charts below show how much of the daily needs can be covered by 300 grams of the food.
2
100 g
300 g
2 cookie 1 serving - 36g
Vitamin C
Vit. C
Vitamin D
Vit. D
Vitamin A
Vit. A
Vitamin E
Vit. E
Vitamin B1
Vit. B1
Vitamin B2
Vit. B2
Vitamin B3
Vit. B3
Vitamin B5
Vit. B5
Vitamin B6
Vit. B6
Vitamin B12
Vit. B12
Vitamin K
Vit. K
Folate
Folate
0%
0%
0%
3.8%
5%
14%
4.1%
0%
22%
0%
2.8%
2.3%
5
100 g
300 g
1 serving - 197g
Vitamin C
Vit. C
Vitamin D
Vit. D
Vitamin A
Vit. A
Vitamin E
Vit. E
Vitamin B1
Vit. B1
Vitamin B2
Vit. B2
Vitamin B3
Vit. B3
Vitamin B5
Vit. B5
Vitamin B6
Vit. B6
Vitamin B12
Vit. B12
Vitamin K
Vit. K
Folate
Folate
0%
0%
0%
3.8%
93%
26%
77%
10%
14%
0%
1%
74%
All nutrients comparison - raw data values
Nutrient
DV% diff.
Saturated fat
20.099g
0.296g
90%
Iron
0.82mg
3.81mg
37%
Fats
22.55g
0.95g
33%
Vitamin B1
0.02mg
0.37mg
29%
Vitamin B3
0.22mg
4.125mg
24%
Folate
3µg
98µg
24%
Copper
0.269mg
0.102mg
19%
Starch
43.02g
18%
Selenium
6.8µg
16.6µg
18%
Manganese
0.268mg
12%
Calories
460kcal
237kcal
11%
Fiber
5.1g
2.4g
11%
Phosphorus
68mg
146mg
11%
Sodium
241mg
482mg
10%
Protein
3.02g
7.28g
9%
Calcium
5mg
70mg
7%
Carbs
61.22g
49.94g
4%
Zinc
0.73mg
0.32mg
4%
Vitamin B2
0.06mg
0.114mg
4%
Monounsaturated fat
1.61g
0.185g
4%
Vitamin B5
0.17mg
3%
Vitamin B6
0.096mg
0.06mg
3%
Polyunsaturated fat
0.81g
0.391g
3%
Magnesium
29mg
19mg
2%
Choline
9.1mg
2%
Potassium
123mg
105mg
1%
Vitamin K
1.1µg
0.4µg
1%
Protein per 100 calories
0.66g
3.1g
N/A
Calories per 10 g protein
1523kcal
326kcal
N/A
Weight per 100 calories
22g
42g
N/A
Unsaturated / Saturated Fat ratio
0.12
1.9
N/A
Net carbs
56.12g
47.54g
N/A
Sugar
45.16g
2.75g
N/A
Vitamin E
0.19mg
0.19mg
0%
Tryptophan
0.06mg
0%
Threonine
0.182mg
0%
Isoleucine
0.286mg
0%
Leucine
0.53mg
0%
Lysine
0.157mg
0%
Methionine
0.122mg
0%
Phenylalanine
0.375mg
0%
Valine
0.326mg
0%
Histidine
0.165mg
0%
Omega-3 - ALA
0.019g
N/A
Macronutrient Comparison
Macronutrient breakdown side-by-side comparison
2
3%
23%
61%
12%
2%
Protein:
3.02 g
Fats:
22.55 g
Carbs:
61.22 g
Water:
11.5 g
Other:
1.71 g
3
7%
50%
40%
2%
Protein:
7.28 g
Fats:
0.95 g
Carbs:
49.94 g
Water:
39.96 g
Other:
1.87 g
Contains
more
Fats Fats
+2273.7%
Contains
more
Carbs Carbs
+22.6%
Contains
more
Protein Protein
+141.1%
Contains
more
Water Water
+247.5%
Fat Type Comparison
Fat type breakdown side-by-side comparison
2
89%
7%
4%
Saturated fat:
Sat. Fat
20.099 g
Monounsaturated fat:
Mono. Fat
1.61 g
Polyunsaturated fat:
Poly. Fat
0.81 g
1
34%
21%
45%
Saturated fat:
Sat. Fat
0.296 g
Monounsaturated fat:
Mono. Fat
0.185 g
Polyunsaturated fat:
Poly. Fat
0.391 g
Contains
more
Mono. Fat Monounsaturated fat
+770.3%
Contains
more
Poly. Fat Polyunsaturated fat
+107.2%
Contains
less
Sat. Fat Saturated fat
-98.5%