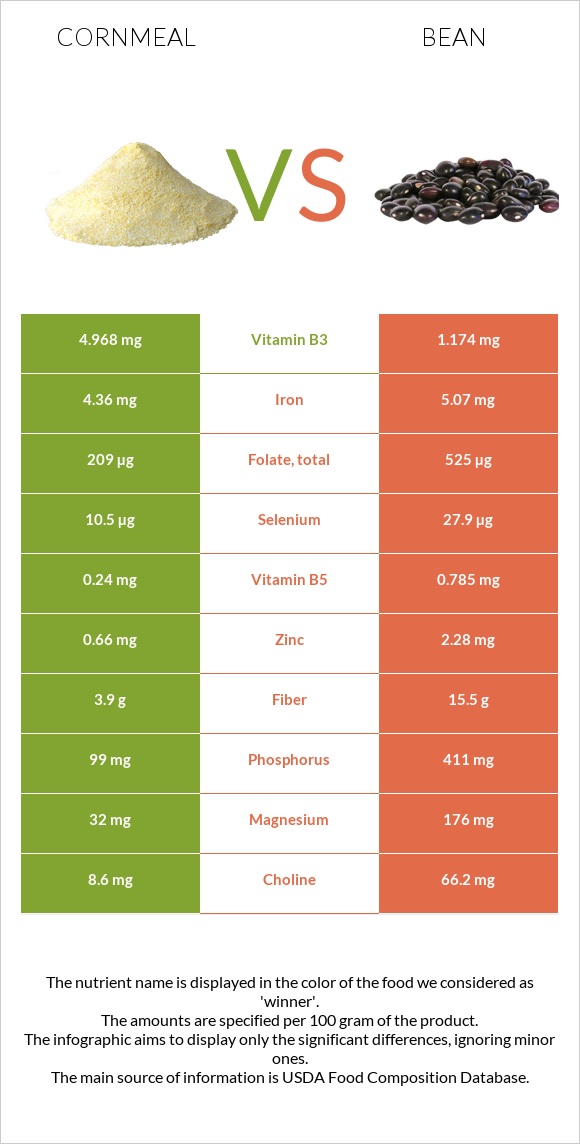
Differences between cornmeal and beans Cornmeal has more iron, folate, vitamin B1, vitamin B3, vitamin B2, and selenium, while beans have more copper, zinc, and fiber. Cornmeal's daily need coverage for iron is 51% higher. Beans contain 12 times less vitamin B3 than cornmeal. Cornmeal contains 4.968mg of vitamin B3, while beans contain 0.43mg. Beans have a lower glycemic index. The glycemic index of beans is 33, while the glycemic index of cornmeal is 68. The food types used in this comparison are Cornmeal, degermed, enriched, yellow and Beans, baked, canned, no salt added .
Infographic
Mineral Comparison
Mineral comparison score is based on the number of minerals by which one or the other food is richer. The "coverage" charts below show how much of the daily needs can be covered by 300 grams of the food.
3
100 g
300 g
1 cup - 157g
Magnesium
Magnesium
Calcium
Calcium
Potassium
Potassium
Iron
Iron
Copper
Copper
Zinc
Zinc
Phosphorus
Phosphorus
Sodium
Sodium
Manganese
Manganese
Selenium
Selenium
23%
0.9%
13%
164%
25%
18%
42%
0.91%
23%
57%
5
100 g
300 g
1 cup - 253g
Magnesium
Magnesium
Calcium
Calcium
Potassium
Potassium
Iron
Iron
Copper
Copper
Zinc
Zinc
Phosphorus
Phosphorus
Sodium
Sodium
Manganese
Manganese
Selenium
Selenium
23%
15%
26%
11%
69%
38%
45%
0.13%
0%
25%
Vitamin Comparison
Vitamin comparison score is based on the number of vitamins by which one or the other food is richer. The "coverage" charts below show how much of the daily needs can be covered by 300 grams of the food.
7
100 g
300 g
1 cup - 157g
Vitamin C
Vit. C
Vitamin D
Vit. D
Vitamin A
Vit. A
Vitamin E
Vit. E
Vitamin B1
Vit. B1
Vitamin B2
Vit. B2
Vitamin B3
Vit. B3
Vitamin B5
Vit. B5
Vitamin B6
Vit. B6
Vitamin B12
Vit. B12
Vitamin K
Vit. K
Folate
Folate
0%
0%
3.7%
2.4%
138%
88%
93%
14%
42%
0%
0%
157%
3
100 g
300 g
1 cup - 253g
Vitamin C
Vit. C
Vitamin D
Vit. D
Vitamin A
Vit. A
Vitamin E
Vit. E
Vitamin B1
Vit. B1
Vitamin B2
Vit. B2
Vitamin B3
Vit. B3
Vitamin B5
Vit. B5
Vitamin B6
Vit. B6
Vitamin B12
Vit. B12
Vitamin K
Vit. K
Folate
Folate
10%
0%
1.7%
3%
38%
14%
8.1%
0%
30%
0%
2%
18%
All nutrients comparison - raw data values
Nutrient
DV% diff.
Iron
4.36mg
0.29mg
51%
Folate
209µg
24µg
46%
Vitamin B1
0.551mg
0.15mg
33%
Starch
73.3g
30%
Vitamin B3
4.968mg
0.43mg
28%
Vitamin B2
0.382mg
0.06mg
25%
Carbs
79.45g
20.49g
20%
Copper
0.076mg
0.206mg
14%
Calories
370kcal
105kcal
13%
Selenium
10.5µg
4.5µg
11%
Manganese
0.174mg
8%
Zinc
0.66mg
1.4mg
7%
Fiber
3.9g
5.5g
6%
Protein
7.11g
4.8g
5%
Calcium
3mg
50mg
5%
Potassium
142mg
296mg
5%
Vitamin B5
0.24mg
5%
Vitamin B6
0.182mg
0.13mg
4%
Choline
8.6mg
30.8mg
4%
Polyunsaturated fat
0.828g
0.172g
4%
Vitamin C
0mg
3.1mg
3%
Fats
1.75g
0.4g
2%
Phosphorus
99mg
104mg
1%
Vitamin A
11µg
5µg
1%
Vitamin K
0µg
0.8µg
1%
Saturated fat
0.22g
0.103g
1%
Monounsaturated fat
0.39g
0.035g
1%
Protein per 100 calories
1.9g
4.6g
N/A
Calories per 10 g protein
520kcal
219kcal
N/A
Weight per 100 calories
27g
95g
N/A
Net carbs
75.55g
14.99g
N/A
Magnesium
32mg
32mg
0%
Sugar
1.61g
7.78g
N/A
Sodium
7mg
1mg
0%
Vitamin E
0.12mg
0.15mg
0%
Tryptophan
0.038mg
0%
Threonine
0.172mg
0%
Isoleucine
0.242mg
0%
Leucine
1.006mg
0%
Lysine
0.105mg
0%
Methionine
0.162mg
0%
Phenylalanine
0.366mg
0%
Valine
0.337mg
0%
Histidine
0.172mg
0%
Fructose
0.17g
0%
Macronutrient Comparison
Macronutrient breakdown side-by-side comparison
3
7%
2%
79%
11%
Protein:
7.11 g
Fats:
1.75 g
Carbs:
79.45 g
Water:
11.18 g
Other:
0.51 g
2
5%
20%
73%
2%
Protein:
4.8 g
Fats:
0.4 g
Carbs:
20.49 g
Water:
72.6 g
Other:
1.71 g
Contains
more
Protein Protein
+48.1%
Contains
more
Fats Fats
+337.5%
Contains
more
Carbs Carbs
+287.8%
Contains
more
Water Water
+549.4%
Contains
more
Other Other
+235.3%
Fat Type Comparison
Fat type breakdown side-by-side comparison
2
15%
27%
58%
Saturated fat:
Sat. Fat
0.22 g
Monounsaturated fat:
Mono. Fat
0.39 g
Polyunsaturated fat:
Poly. Fat
0.828 g
1
33%
11%
55%
Saturated fat:
Sat. Fat
0.103 g
Monounsaturated fat:
Mono. Fat
0.035 g
Polyunsaturated fat:
Poly. Fat
0.172 g
Contains
more
Mono. Fat Monounsaturated fat
+1014.3%
Contains
more
Poly. Fat Polyunsaturated fat
+381.4%
Contains
less
Sat. Fat Saturated fat
-53.2%