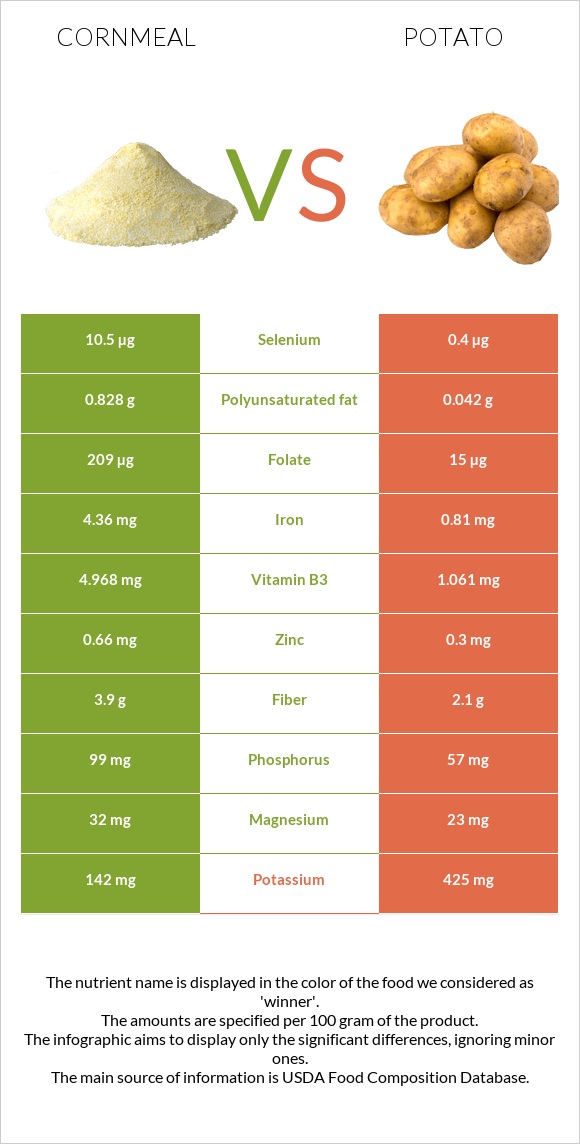
The main differences between cornmeal and potatoes Cornmeal has more folate, iron, vitamin B1, vitamin B2, vitamin B3, selenium, and fiber; however, potatoes have more vitamin C, vitamin B6, and potassium. Daily need coverage for folate for cornmeal is 49% higher. Potatoes have 26 times less selenium than cornmeal. Cornmeal has 10.5µg of selenium, while potatoes have 0.4µg. Potatoes have a higher glycemic index than cornmeal. Food types used in this article are Cornmeal, degermed, enriched, yellow and Potatoes, flesh, and skin, raw .
Infographic
Mineral Comparison
Mineral comparison score is based on the number of minerals by which one or the other food is richer. The "coverage" charts below show how much of the daily needs can be covered by 300 grams of the food.
5
100 g
300 g
1 cup - 157g
Magnesium
Magnesium
Calcium
Calcium
Potassium
Potassium
Iron
Iron
Copper
Copper
Zinc
Zinc
Phosphorus
Phosphorus
Sodium
Sodium
Manganese
Manganese
Selenium
Selenium
23%
0.9%
13%
164%
25%
18%
42%
0.91%
23%
57%
5
100 g
300 g
0.5 cup, diced - 75g 1 Potato small (1-3/4" to 2-1/2" dia) - 170g 1 Potato medium (2-1/4" to 3-1/4" dia) - 213g 1 Potato large (3" to 4-1/4" dia) - 369g
Magnesium
Magnesium
Calcium
Calcium
Potassium
Potassium
Iron
Iron
Copper
Copper
Zinc
Zinc
Phosphorus
Phosphorus
Sodium
Sodium
Manganese
Manganese
Selenium
Selenium
16%
3.6%
38%
30%
37%
8.2%
24%
0.78%
26%
2.2%
Vitamin Comparison
Vitamin comparison score is based on the number of vitamins by which one or the other food is richer. The "coverage" charts below show how much of the daily needs can be covered by 300 grams of the food.
6
100 g
300 g
1 cup - 157g
Vitamin C
Vit. C
Vitamin D
Vit. D
Vitamin A
Vit. A
Vitamin E
Vit. E
Vitamin B1
Vit. B1
Vitamin B2
Vit. B2
Vitamin B3
Vit. B3
Vitamin B5
Vit. B5
Vitamin B6
Vit. B6
Vitamin B12
Vit. B12
Vitamin K
Vit. K
Folate
Folate
0%
0%
3.7%
2.4%
138%
88%
93%
14%
42%
0%
0%
157%
4
100 g
300 g
0.5 cup, diced - 75g 1 Potato small (1-3/4" to 2-1/2" dia) - 170g 1 Potato medium (2-1/4" to 3-1/4" dia) - 213g 1 Potato large (3" to 4-1/4" dia) - 369g
Vitamin C
Vit. C
Vitamin D
Vit. D
Vitamin A
Vit. A
Vitamin E
Vit. E
Vitamin B1
Vit. B1
Vitamin B2
Vit. B2
Vitamin B3
Vit. B3
Vitamin B5
Vit. B5
Vitamin B6
Vit. B6
Vitamin B12
Vit. B12
Vitamin K
Vit. K
Folate
Folate
66%
0%
0%
0.2%
20%
7.4%
20%
18%
69%
0%
5%
11%
All nutrients comparison - raw data values
Nutrient
DV% diff.
Folate
209µg
15µg
49%
Iron
4.36mg
0.81mg
44%
Vitamin B1
0.551mg
0.081mg
39%
Vitamin B2
0.382mg
0.032mg
27%
Starch
73.3g
15.29g
24%
Vitamin B3
4.968mg
1.061mg
24%
Vitamin C
0mg
19.7mg
22%
Carbs
79.45g
17.49g
21%
Selenium
10.5µg
0.4µg
18%
Calories
370kcal
77kcal
15%
Protein
7.11g
2.05g
10%
Vitamin B6
0.182mg
0.298mg
9%
Potassium
142mg
425mg
8%
Fiber
3.9g
2.1g
7%
Phosphorus
99mg
57mg
6%
Polyunsaturated fat
0.828g
0.042g
5%
Copper
0.076mg
0.11mg
4%
Fats
1.75g
0.09g
3%
Zinc
0.66mg
0.3mg
3%
Magnesium
32mg
23mg
2%
Vitamin K
0µg
2µg
2%
Calcium
3mg
12mg
1%
Vitamin A
11µg
0µg
1%
Vitamin E
0.12mg
0.01mg
1%
Manganese
0.174mg
0.2mg
1%
Vitamin B5
0.24mg
0.295mg
1%
Choline
8.6mg
12.1mg
1%
Saturated fat
0.22g
0.025g
1%
Monounsaturated fat
0.39g
0.002g
1%
Protein per 100 calories
1.9g
2.7g
N/A
Calories per 10 g protein
520kcal
376kcal
N/A
Weight per 100 calories
27g
130g
N/A
Net carbs
75.55g
15.39g
N/A
Sugar
1.61g
0.82g
N/A
Sodium
7mg
6mg
0%
Tryptophan
0.038mg
0.021mg
0%
Threonine
0.172mg
0.067mg
0%
Isoleucine
0.242mg
0.066mg
0%
Leucine
1.006mg
0.098mg
0%
Lysine
0.105mg
0.107mg
0%
Methionine
0.162mg
0.032mg
0%
Phenylalanine
0.366mg
0.081mg
0%
Valine
0.337mg
0.103mg
0%
Histidine
0.172mg
0.035mg
0%
Fructose
0.17g
0.26g
0%
Macronutrient Comparison
Macronutrient breakdown side-by-side comparison
3
7%
2%
79%
11%
Protein:
7.11 g
Fats:
1.75 g
Carbs:
79.45 g
Water:
11.18 g
Other:
0.51 g
2
2%
17%
79%
Protein:
2.05 g
Fats:
0.09 g
Carbs:
17.49 g
Water:
79.25 g
Other:
1.12 g
Contains
more
Protein Protein
+246.8%
Contains
more
Fats Fats
+1844.4%
Contains
more
Carbs Carbs
+354.3%
Contains
more
Water Water
+608.9%
Contains
more
Other Other
+119.6%
Fat Type Comparison
Fat type breakdown side-by-side comparison
2
15%
27%
58%
Saturated fat:
Sat. Fat
0.22 g
Monounsaturated fat:
Mono. Fat
0.39 g
Polyunsaturated fat:
Poly. Fat
0.828 g
1
36%
3%
61%
Saturated fat:
Sat. Fat
0.025 g
Monounsaturated fat:
Mono. Fat
0.002 g
Polyunsaturated fat:
Poly. Fat
0.042 g
Contains
more
Mono. Fat Monounsaturated fat
+19400%
Contains
more
Poly. Fat Polyunsaturated fat
+1871.4%
Contains
less
Sat. Fat Saturated fat
-88.6%
Carbohydrate type comparison
Carbohydrate type breakdown side-by-side comparison
4
98%
Starch:
73.3 g
Sucrose:
0.68 g
Glucose:
0.56 g
Fructose:
0.17 g
Lactose:
0 g
Maltose:
0.19 g
Galactose:
0 g
1
95%
2%
Starch:
15.29 g
Sucrose:
0.17 g
Glucose:
0.31 g
Fructose:
0.26 g
Lactose:
0 g
Maltose:
0 g
Galactose:
0 g
Contains
more
Starch Starch
+379.4%
Contains
more
Sucrose Sucrose
+300%
Contains
more
Glucose Glucose
+80.6%
Contains
more
Maltose Maltose
+∞%
Contains
more
Fructose Fructose
+52.9%
~equal in
Lactose
~0g
~equal in
Galactose
~0g