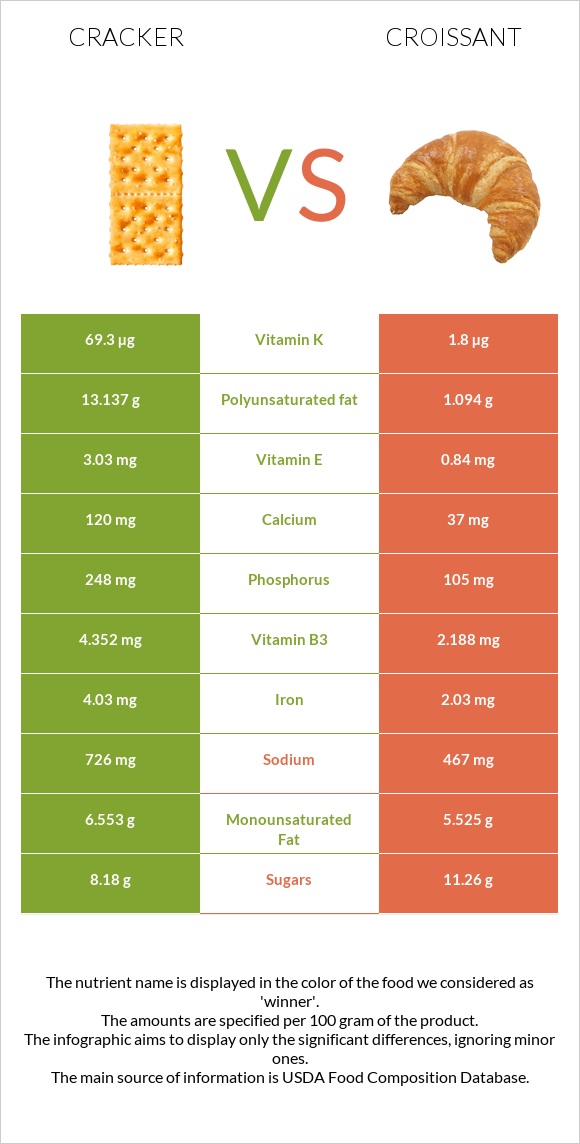
How are crackers and croissant different? Crackers have more vitamin K, iron, phosphorus, vitamin B2, vitamin E, and vitamin B3; however, croissant is richer in selenium and vitamin A. Crackers cover your daily need for vitamin K, 56% more than croissant. Crackers have 4 times more vitamin E than croissant. Crackers have 3.03mg of vitamin E, while croissant has 0.84mg. Crackers contain less saturated fat. Crackers, standard snack-type, regular and Croissants, butter types were used in this article.
Infographic
Mineral Comparison
Mineral comparison score is based on the number of minerals by which one or the other food is richer. The "coverage" charts below show how much of the daily needs can be covered by 300 grams of the food.
6
100 g
300 g
1 cracker, round - 3.2g 1 cracker, rectangular - 4g 5 crackers - 16g 5 crackers, regular size, round (1 serving) - 16g 1 cup crushed - 52g
Magnesium
Magnesium
Calcium
Calcium
Potassium
Potassium
Iron
Iron
Copper
Copper
Zinc
Zinc
Phosphorus
Phosphorus
Sodium
Sodium
Manganese
Manganese
Selenium
Selenium
13%
36%
10%
151%
35%
13%
106%
95%
64%
37%
3
100 g
300 g
1 croissant, mini - 28g 1 oz - 28.35g 1 croissant, small - 42g 1 croissant, medium - 57g 1 croissant, large - 67g
Magnesium
Magnesium
Calcium
Calcium
Potassium
Potassium
Iron
Iron
Copper
Copper
Zinc
Zinc
Phosphorus
Phosphorus
Sodium
Sodium
Manganese
Manganese
Selenium
Selenium
11%
11%
10%
76%
27%
20%
45%
61%
43%
124%
Vitamin Comparison
Vitamin comparison score is based on the number of vitamins by which one or the other food is richer. The "coverage" charts below show how much of the daily needs can be covered by 300 grams of the food.
4
100 g
300 g
1 cracker, round - 3.2g 1 cracker, rectangular - 4g 5 crackers - 16g 5 crackers, regular size, round (1 serving) - 16g 1 cup crushed - 52g
Vitamin C
Vit. C
Vitamin D
Vit. D
Vitamin A
Vit. A
Vitamin E
Vit. E
Vitamin B1
Vit. B1
Vitamin B2
Vit. B2
Vitamin B3
Vit. B3
Vitamin B5
Vit. B5
Vitamin B6
Vit. B6
Vitamin B12
Vit. B12
Vitamin K
Vit. K
Folate
Folate
0%
0%
0%
61%
104%
105%
82%
25%
15%
0%
173%
69%
4
100 g
300 g
1 croissant, mini - 28g 1 oz - 28.35g 1 croissant, small - 42g 1 croissant, medium - 57g 1 croissant, large - 67g
Vitamin C
Vit. C
Vitamin D
Vit. D
Vitamin A
Vit. A
Vitamin E
Vit. E
Vitamin B1
Vit. B1
Vitamin B2
Vit. B2
Vitamin B3
Vit. B3
Vitamin B5
Vit. B5
Vitamin B6
Vit. B6
Vitamin B12
Vit. B12
Vitamin K
Vit. K
Folate
Folate
0.67%
0%
69%
17%
97%
56%
41%
52%
13%
20%
4.5%
66%
All nutrients comparison - raw data values
Nutrient
DV% diff.
Polyunsaturated fat
13.137g
1.094g
80%
Vitamin K
69.3µg
1.8µg
56%
Selenium
6.7µg
22.7µg
29%
Saturated fat
5.562g
11.659g
28%
Iron
4.03mg
2.03mg
25%
Vitamin A
0µg
206µg
23%
Cholesterol
0mg
67mg
22%
Starch
49.69g
20%
Phosphorus
248mg
105mg
20%
Vitamin B2
0.456mg
0.241mg
17%
Vitamin E
3.03mg
0.84mg
15%
Vitamin B3
4.352mg
2.188mg
14%
Sodium
726mg
467mg
11%
Vitamin B5
0.417mg
0.861mg
9%
Fats
26.43g
21g
8%
Calcium
120mg
37mg
8%
Manganese
0.491mg
0.33mg
7%
Vitamin B12
0µg
0.16µg
7%
Calories
510kcal
406kcal
5%
Carbs
61.3g
45.8g
5%
Choline
9.6mg
38.8mg
5%
Protein
6.64g
8.2g
3%
Copper
0.104mg
0.08mg
3%
Monounsaturated fat
6.553g
5.525g
3%
Zinc
0.49mg
0.75mg
2%
Vitamin B1
0.416mg
0.388mg
2%
Fiber
2.3g
2.6g
1%
Folate
92µg
88µg
1%
Protein per 100 calories
1.3g
2g
N/A
Calories per 10 g protein
768kcal
495kcal
N/A
Weight per 100 calories
20g
25g
N/A
Unsaturated / Saturated Fat ratio
3.5
0.57
N/A
Vitamin C
0mg
0.2mg
0%
Net carbs
59g
43.2g
N/A
Magnesium
18mg
16mg
0%
Potassium
118mg
118mg
0%
Sugar
8.18g
11.26g
N/A
Vitamin B6
0.063mg
0.058mg
0%
Trans fat
1.076g
N/A
Tryptophan
0.084mg
0.099mg
0%
Threonine
0.193mg
0.284mg
0%
Isoleucine
0.246mg
0.365mg
0%
Leucine
0.471mg
0.623mg
0%
Lysine
0.103mg
0.329mg
0%
Methionine
0.112mg
0.175mg
0%
Phenylalanine
0.331mg
0.416mg
0%
Valine
0.294mg
0.41mg
0%
Histidine
0.145mg
0.187mg
0%
Fructose
0.29g
0%
Omega-3 - EPA
0g
0.003g
N/A
Omega-3 - DHA
0g
0.002g
N/A
Omega-3 - ALA
1.485g
N/A
Omega-6 - Gamma-linoleic acid
0.062g
N/A
Omega-6 - Eicosadienoic acid
0.009g
N/A
Omega-6 - Linoleic acid
11.48g
N/A
Macronutrient Comparison
Macronutrient breakdown side-by-side comparison
3
7%
26%
61%
3%
2%
Protein:
6.64 g
Fats:
26.43 g
Carbs:
61.3 g
Water:
3.14 g
Other:
2.49 g
2
8%
21%
46%
23%
2%
Protein:
8.2 g
Fats:
21 g
Carbs:
45.8 g
Water:
23.2 g
Other:
1.8 g
Contains
more
Fats Fats
+25.9%
Contains
more
Carbs Carbs
+33.8%
Contains
more
Other Other
+38.3%
Contains
more
Protein Protein
+23.5%
Contains
more
Water Water
+638.9%
Fat Type Comparison
Fat type breakdown side-by-side comparison
3
22%
26%
52%
Saturated fat:
Sat. Fat
5.562 g
Monounsaturated fat:
Mono. Fat
6.553 g
Polyunsaturated fat:
Poly. Fat
13.137 g
0
64%
30%
6%
Saturated fat:
Sat. Fat
11.659 g
Monounsaturated fat:
Mono. Fat
5.525 g
Polyunsaturated fat:
Poly. Fat
1.094 g
Contains
less
Sat. Fat Saturated fat
-52.3%
Contains
more
Mono. Fat Monounsaturated fat
+18.6%
Contains
more
Poly. Fat Polyunsaturated fat
+1100.8%