Crackers nutrition: calories, carbs, GI, protein, fiber, fats
Carbs in crackers
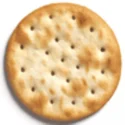
Carbs are the highest constituent in crackers when we consider macros. The total carbohydrate amount is 61g in 100g of crackers.
This amount is 20% of the daily caloric coverage when considering 2000 calories as an average.
Below we can see in the chart the distribution of carbs.
Macronutrients chart
Carbs per serving size
The serving size of crackers is about 16g, equivalent to 5 crackers. Thus the total carb content of 1 serving size would be approximately 10g.
Of these, 9.4g are net carbs, and the rest fibers.
Carbohydrate type breakdown
The chart below indicates the carbohydrate distribution of crackers. The carbohydrate distribution is mostly starch-based.
Net carbs in crackers
The net carbs of crackers equal 59g of the total carbs, which is 61g per 100g of crackers. This food is high in carbs and cannot be part of a low-carb diet.
Carbohydrate type breakdown
Fiber distribution in crackers
Crackers do not contain high amounts of fiber since they are flour-based and processed foods. The fiber content per serving is nearly 0.6g of fibers. Nearly 1.2-1.5% of the daily requirement is not highly significant.
Fiber content ratio for Crackers

Top nutrition facts for Crackers
| Calories ⓘ Calories for selected serving | 510 kcal |
|
Glycemic index ⓘ
Source:
Check out our Glycemic index chart page for the full list.
|
63 (medium) |
| Glycemic load ⓘ Glycemic Load (GL) is a metric that measures both the quality (Glycemic Index) and quantity of carbohydrates in a specific serving of food to estimate its impact on blood sugar levels. It is calculated as: (GI × Carbs in grams) / 100. | 6 (low) |
| Insulin index ⓘ The insulin index of foods demonstrates how much a food increases the insulin level in the blood, in the first two-hour period after consumption. | 87 ⓘ https://www.ncbi.nlm.nih.gov/pmc/articles/PMC6770275/ – 71 |
| Net carbs ⓘ Net Carbs = Total Carbohydrates – Fiber – Sugar Alcohols | 59 g |
| Default serving size ⓘ Serving sizes are mostly taken from FDA's Reference Amounts Customarily Consumed (RACCs) | 5 crackers (16 g) |
| Acidity (Based on PRAL) ⓘ PRAL (Potential renal acid load) is calculated using a formula. On the PRAL scale the higher the positive value, the more is the acidifying effect on the body. The lower the negative value, the higher the alkalinity of the food. 0 is neutral. | 7.9 (acidic) |
| Oxalates | 39 mg ⓘ https://www.researchgate.net/publication/223499374 |
Crackers calories (kcal)
| Calories for different serving sizes of crackers | Calories | Weight |
|---|---|---|
| Calories in 100 grams | 510 | |
| Calories in 1 cracker, round | 16 | 3.2 g |
| Calories in 1 cracker, rectangular | 20 | 4 g |
| Calories in 5 crackers | 82 | 16 g |
| Calories in 1 cup crushed | 265 | 52 g |
| Calories for different varieties of crackers | Calories | Weight |
|---|---|---|
| Crackers, standard snack-type, regular (this food) | 510 | 100 g |
| Crackers, water biscuits | 384 | 100 g |
| Crackers, toast thins, low sodium | 442 | 100 g |
| Crackers, wheat, reduced fat | 444 | 100 g |
| Crackers, wheat, regular | 455 | 100 g |
| Crackers, standard snack-type, with whole wheat | 463 | 100 g |
| Crackers, wheat, low salt | 473 | 100 g |
| Crackers, standard snack-type, sandwich, with cheese filling | 477 | 100 g |
| Crackers, standard snack-type, sandwich, with peanut butter filling | 494 | 100 g |
| Crackers, standard snack-type, regular, low salt | 502 | 100 g |
Extra Nutrition facts for Crackers
| Protein per 100 calories ⓘ Shows how many grams of protein you get from 100 calories of this food, calculated as (protein in g ÷ calories) × 100. | 1.3 g |
| Calories per 10 g protein ⓘ Shows how many calories you need to eat from this food to get 10 g of protein, calculated as (calories ÷ protein in g) × 10. | 768 kcal |
| Weight per 100 calories ⓘ Shows how many grams of this food equal 100 kcal—higher grams mean a larger portion for the same calories. | 20 g |
| Unsaturated / Saturated Fat ratio ⓘ (monounsaturated + polyunsaturated) / saturated, ≥2 broadly recommended by major guidelines for heart health | 3.5 |
Crackers Glycemic index (GI)
Crackers Glycemic load (GL)
Mineral coverage chart
Mineral chart - relative view
Vitamin coverage chart
Vitamin chart - relative view
Protein quality breakdown
Fat type information
All nutrients for Crackers per 100g
| Nutrient | Value | DV% | In TOP % of foods | Comparison |
| Vitamin A | 0µg | 0% | 100% | |
| Calories | 510kcal | 26% | 6% |
10.9 times more than Orange
|
| Protein | 6.6g | 16% | 55% |
2.4 times more than Broccoli
|
| Protein per 100 calories | 1.3g | N/A | 81% | |
| Calories per 10 g protein | 768kcal | N/A | 16% | |
| Weight per 100 calories | 20g | N/A | 94% | |
| Fats | 26g | 41% | 10% |
1.3 times less than Cheese
|
| Unsaturated / Saturated Fat ratio | 3.5 | N/A | 21% | |
| Vitamin C | 0mg | 0% | 100% |
N/A
|
| Carbs | 61g | 20% | 16% |
2.2 times more than Rice
|
| Net carbs | 59g | N/A | 15% |
1.1 times more than Chocolate
|
| Cholesterol | 0mg | 0% | 100% |
N/A
|
| Vitamin D* | 0 IU | 0% | 100% |
N/A
|
| Vitamin D | 0µg | 0% | 100% |
N/A
|
| Magnesium | 18mg | 4% | 59% |
7.8 times less than Almonds
|
| Calcium | 120mg | 12% | 16% |
Equal to Milk
|
| Potassium | 118mg | 3% | 74% |
1.2 times less than Cucumber
|
| Iron | 4mg | 50% | 12% |
1.6 times more than Beef broiled
|
| Sugar | 8.2g | N/A | 22% |
1.1 times less than Coca-Cola
|
| Fiber | 2.3g | 9% | 27% |
Equal to Orange
|
| Copper | 0.1mg | 12% | 37% |
1.4 times less than Shiitake
|
| Zinc | 0.49mg | 4% | 63% |
12.9 times less than Beef broiled
|
| Starch | 50g | 20% | 2% |
3.2 times more than Potato
|
| Phosphorus | 248mg | 35% | 17% |
1.4 times more than Chicken meat
|
| Sodium | 726mg | 32% | 11% |
1.5 times more than White bread
|
| Vitamin E | 3mg | 20% | 6% |
2.1 times more than Kiwi
|
| Manganese | 0.49mg | 21% | 14% | |
| Selenium | 6.7µg | 12% | 46% | |
| Vitamin B1 | 0.42mg | 35% | 14% |
1.6 times more than Pea raw
|
| Vitamin B2 | 0.46mg | 35% | 9% |
3.5 times more than Avocado
|
| Vitamin B3 | 4.4mg | 27% | 31% |
2.2 times less than Turkey meat
|
| Vitamin B5 | 0.42mg | 8% | 39% |
2.7 times less than Sunflower seeds
|
| Vitamin B6 | 0.06mg | 5% | 64% |
1.9 times less than Oats
|
| Vitamin B12 | 0µg | 0% | 100% |
N/A
|
| Vitamin K | 69µg | 58% | 3% |
1.5 times less than Broccoli
|
| Folate | 92µg | 23% | 11% |
1.5 times more than Brussels sprouts
|
| Trans fat | 1.1g | N/A | 3% |
13.8 times less than Margarine
|
| Choline | 9.6mg | 2% | 41% | |
| Saturated fat | 5.6g | 28% | 19% |
1.1 times less than Beef broiled
|
| Monounsaturated fat | 6.6g | N/A | 17% |
1.5 times less than Avocado
|
| Polyunsaturated fat | 13g | N/A | 3% |
3.6 times less than Walnut
|
| Tryptophan | 0.08mg | 0% | 39% |
3.6 times less than Chicken meat
|
| Threonine | 0.19mg | 0% | 43% |
3.7 times less than Beef broiled
|
| Isoleucine | 0.25mg | 0% | 42% |
3.7 times less than Salmon raw
|
| Leucine | 0.47mg | 0% | 42% |
5.2 times less than Tuna Bluefin
|
| Lysine | 0.1mg | 0% | 50% |
4.4 times less than Tofu
|
| Methionine | 0.11mg | 0% | 41% |
1.2 times more than Quinoa
|
| Phenylalanine | 0.33mg | 0% | 40% |
2 times less than Egg
|
| Valine | 0.29mg | 0% | 42% |
6.9 times less than Soybean raw
|
| Histidine | 0.15mg | 0% | 42% |
5.2 times less than Turkey meat
|
| Fructose | 0.29g | 0% | 10% |
20.3 times less than Apple
|
| Caffeine | 0mg | 0% | 100% | |
| Omega-3 - EPA | 0g | N/A | 100% |
N/A
|
| Omega-3 - DHA | 0g | N/A | 100% |
N/A
|
| Omega-3 - ALA | 1.5g | N/A | 1% |
6.2 times less than Canola oil
|
| Omega-3 - DPA | 0g | N/A | 100% |
N/A
|
| Omega-3 - Eicosatrienoic acid | 0g | N/A | 100% | |
| Omega-6 - Gamma-linoleic acid | 0.06g | N/A | 1% | |
| Omega-6 - Dihomo-gamma-linoleic acid | 0g | N/A | 100% | |
| Omega-6 - Eicosadienoic acid | 0.01g | N/A | 8% | |
| Omega-6 - Linoleic acid | 11g | N/A | 1% |
1.1 times less than Almonds
|
Check out similar food or compare with current
NUTRITION FACTS LABEL
Serving Size ______________
Health checks
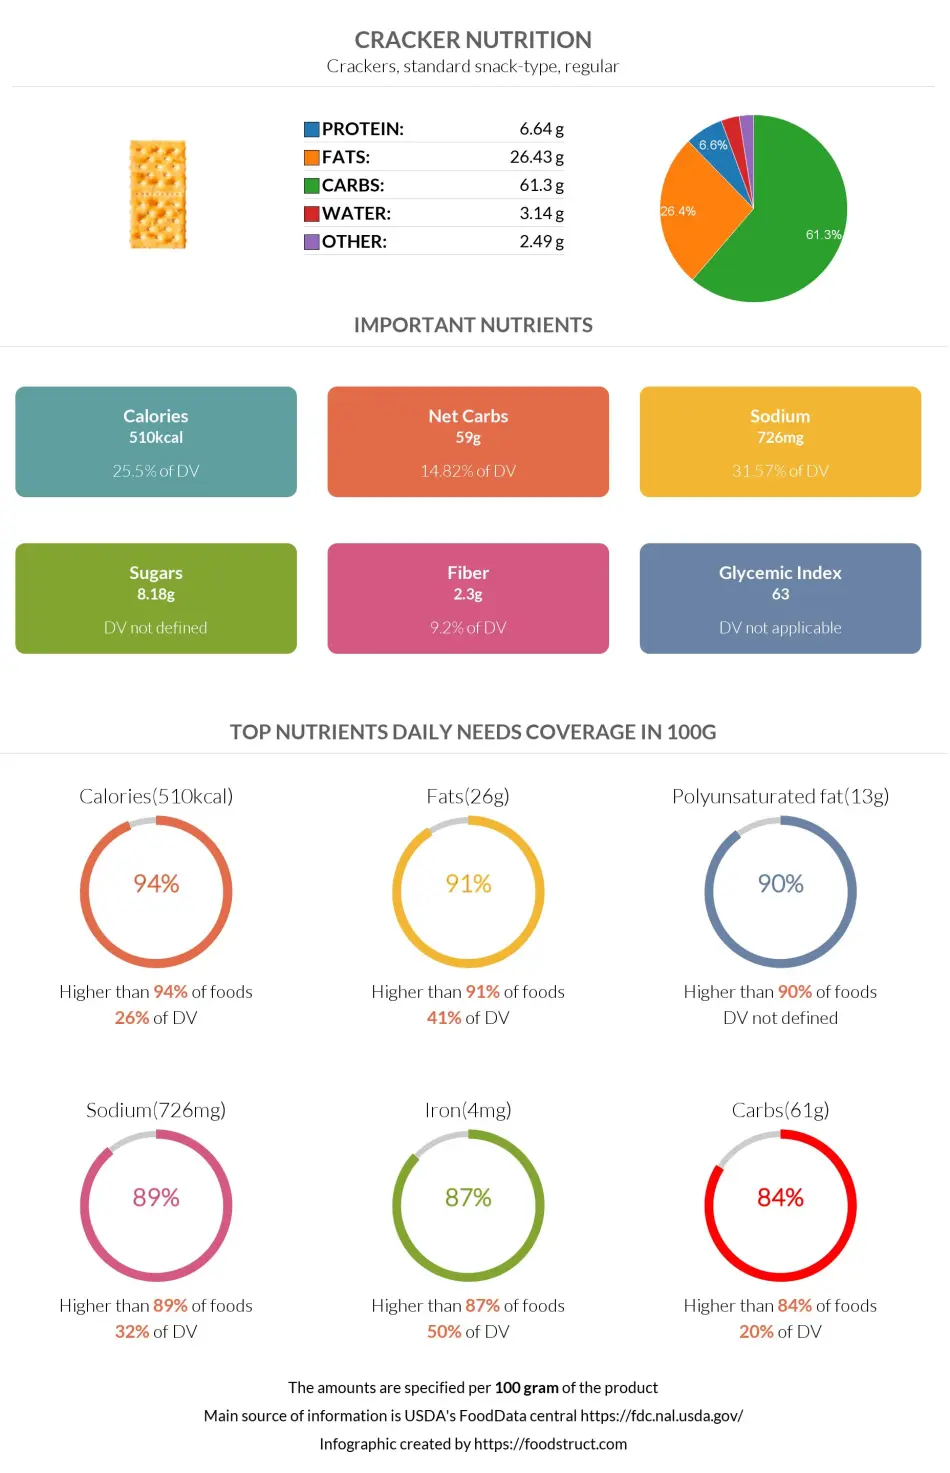
Crackers nutrition infographic
References
All the values for which the sources are not specified explicitly are taken from FDA’s Food Central. The exact link to the food presented on this page can be found below.