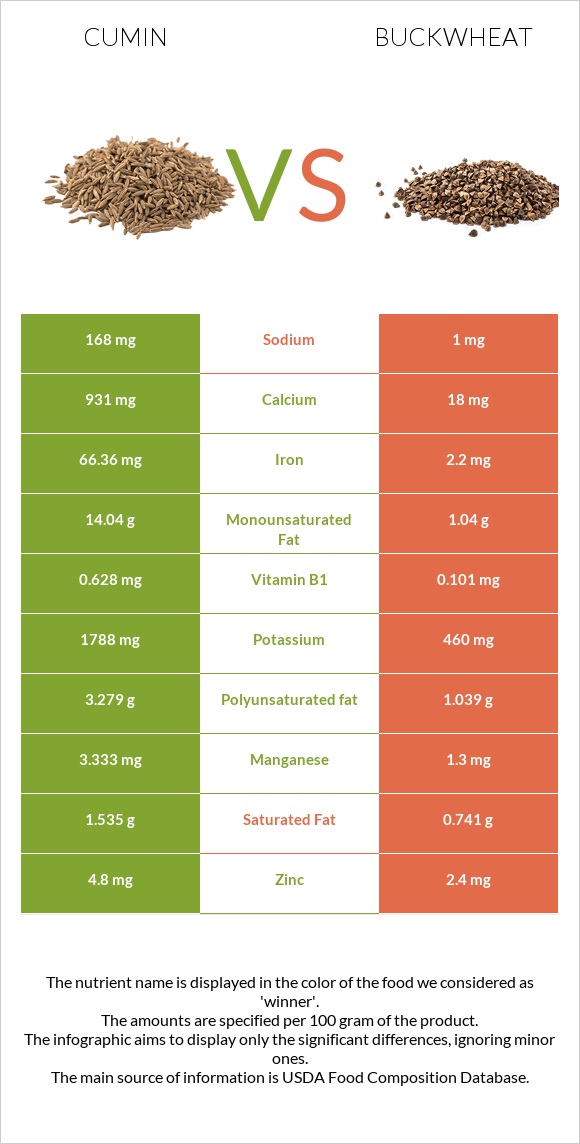
The main differences between cumin and buckwheat Buckwheat contains less iron, manganese, calcium, copper, magnesium, phosphorus, potassium, vitamin B1, zinc, and fiber than cumin. Daily need coverage for iron for cumin is 820% higher. Buckwheat has 133 times less calcium than cumin. Cumin has 931mg of calcium, while buckwheat has 7mg. Buckwheat has a higher glycemic index than cumin. Food types used in this article are Spices, cumin seed and Buckwheat groats, roasted, cooked .
Infographic
Mineral Comparison
Mineral comparison score is based on the number of minerals by which one or the other food is richer. The "coverage" charts below show how much of the daily needs can be covered by 300 grams of the food.
9
100 g
300 g
0.25 tsp, whole - 0.5g 1 tbsp, whole - 6g
Magnesium
Magnesium
Calcium
Calcium
Potassium
Potassium
Iron
Iron
Copper
Copper
Zinc
Zinc
Phosphorus
Phosphorus
Sodium
Sodium
Manganese
Manganese
Selenium
Selenium
261%
279%
158%
2489%
289%
131%
214%
22%
435%
28%
1
100 g
300 g
1 cup - 168g
Magnesium
Magnesium
Calcium
Calcium
Potassium
Potassium
Iron
Iron
Copper
Copper
Zinc
Zinc
Phosphorus
Phosphorus
Sodium
Sodium
Manganese
Manganese
Selenium
Selenium
36%
2.1%
7.8%
30%
49%
17%
30%
0.52%
53%
12%
Vitamin Comparison
Vitamin comparison score is based on the number of vitamins by which one or the other food is richer. The "coverage" charts below show how much of the daily needs can be covered by 300 grams of the food.
8
100 g
300 g
0.25 tsp, whole - 0.5g 1 tbsp, whole - 6g
Vitamin C
Vit. C
Vitamin D
Vit. D
Vitamin A
Vit. A
Vitamin E
Vit. E
Vitamin B1
Vit. B1
Vitamin B2
Vit. B2
Vitamin B3
Vit. B3
Vitamin B5
Vit. B5
Vitamin B6
Vit. B6
Vitamin B12
Vit. B12
Vitamin K
Vit. K
Folate
Folate
26%
0%
21%
67%
157%
75%
86%
0%
100%
0%
14%
7.5%
2
100 g
300 g
1 cup - 168g
Vitamin C
Vit. C
Vitamin D
Vit. D
Vitamin A
Vit. A
Vitamin E
Vit. E
Vitamin B1
Vit. B1
Vitamin B2
Vit. B2
Vitamin B3
Vit. B3
Vitamin B5
Vit. B5
Vitamin B6
Vit. B6
Vitamin B12
Vit. B12
Vitamin K
Vit. K
Folate
Folate
0%
0%
0%
1.8%
10%
9%
18%
22%
18%
0%
4.8%
11%
All nutrients comparison - raw data values
Nutrient
DV% diff.
Iron
66.36mg
0.8mg
820%
Manganese
3.333mg
0.403mg
127%
Calcium
931mg
7mg
92%
Copper
0.867mg
0.146mg
80%
Magnesium
366mg
51mg
75%
Phosphorus
499mg
70mg
61%
Potassium
1788mg
88mg
50%
Vitamin B1
0.628mg
0.04mg
49%
Zinc
4.8mg
0.61mg
38%
Monounsaturated fat
14.04g
0.188g
35%
Fats
22.27g
0.62g
33%
Fiber
10.5g
2.7g
31%
Protein
17.81g
3.38g
29%
Vitamin B6
0.435mg
0.077mg
28%
Vitamin B3
4.579mg
0.94mg
23%
Vitamin E
3.33mg
0.09mg
22%
Vitamin B2
0.327mg
0.039mg
22%
Polyunsaturated fat
3.279g
0.188g
21%
Calories
375kcal
92kcal
14%
Vitamin C
7.7mg
0mg
9%
Carbs
44.24g
19.94g
8%
Sodium
168mg
4mg
7%
Vitamin A
64µg
0µg
7%
Vitamin B5
0.359mg
7%
Saturated fat
1.535g
0.134g
6%
Selenium
5.2µg
2.2µg
5%
Vitamin K
5.4µg
1.9µg
3%
Folate
10µg
14µg
1%
Choline
24.7mg
20.1mg
1%
Protein per 100 calories
4.7g
3.7g
N/A
Calories per 10 g protein
211kcal
272kcal
N/A
Weight per 100 calories
27g
109g
N/A
Unsaturated / Saturated Fat ratio
11
2.8
N/A
Net carbs
33.74g
17.24g
N/A
Sugar
2.25g
0.9g
N/A
Tryptophan
0.049mg
0%
Threonine
0.129mg
0%
Isoleucine
0.127mg
0%
Leucine
0.212mg
0%
Lysine
0.172mg
0%
Methionine
0.044mg
0%
Phenylalanine
0.133mg
0%
Valine
0.173mg
0%
Histidine
0.079mg
0%
Fructose
0.1g
0%
Macronutrient Comparison
Macronutrient breakdown side-by-side comparison
4
18%
22%
44%
8%
8%
Protein:
17.81 g
Fats:
22.27 g
Carbs:
44.24 g
Water:
8.06 g
Other:
7.62 g
1
3%
20%
76%
Protein:
3.38 g
Fats:
0.62 g
Carbs:
19.94 g
Water:
75.63 g
Other:
0.43 g
Contains
more
Protein Protein
+426.9%
Contains
more
Fats Fats
+3491.9%
Contains
more
Carbs Carbs
+121.9%
Contains
more
Other Other
+1672.1%
Contains
more
Water Water
+838.3%
Fat Type Comparison
Fat type breakdown side-by-side comparison
2
8%
74%
17%
Saturated fat:
Sat. Fat
1.535 g
Monounsaturated fat:
Mono. Fat
14.04 g
Polyunsaturated fat:
Poly. Fat
3.279 g
1
26%
37%
37%
Saturated fat:
Sat. Fat
0.134 g
Monounsaturated fat:
Mono. Fat
0.188 g
Polyunsaturated fat:
Poly. Fat
0.188 g
Contains
more
Mono. Fat Monounsaturated fat
+7368.1%
Contains
more
Poly. Fat Polyunsaturated fat
+1644.1%
Contains
less
Sat. Fat Saturated fat
-91.3%