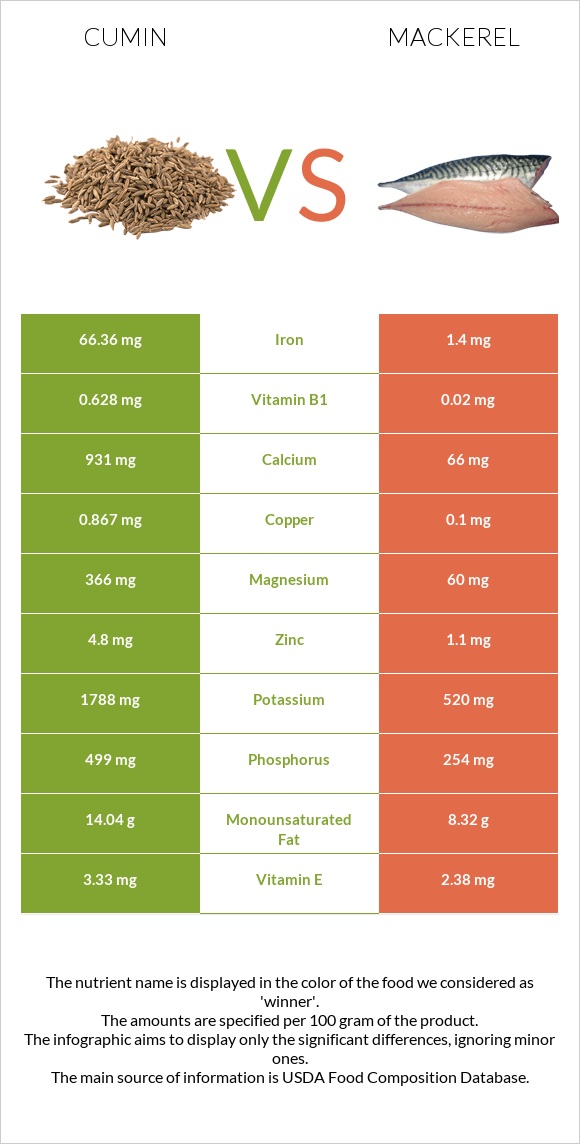
The main differences between cumin and mackerel Cumin has more iron, calcium, copper, magnesium, vitamin B1, and fiber; however, mackerel has more vitamin B12, vitamin D* and selenium. Daily need coverage for iron for cumin is 812% higher. Cumin is lower in sodium. Food types used in this article are Spices, cumin seed and Fish, mackerel, salted .
Infographic
Mineral Comparison
Mineral comparison score is based on the number of minerals by which one or the other food is richer. The "coverage" charts below show how much of the daily needs can be covered by 300 grams of the food.
9
100 g
300 g
0.25 tsp, whole - 0.5g 1 tbsp, whole - 6g
Magnesium
Magnesium
Calcium
Calcium
Potassium
Potassium
Iron
Iron
Copper
Copper
Zinc
Zinc
Phosphorus
Phosphorus
Sodium
Sodium
Manganese
Manganese
Selenium
Selenium
261%
279%
158%
2489%
289%
131%
214%
22%
435%
28%
1
100 g
300 g
1 cubic inch, boneless - 17g 1 piece (5-1/2" x 1-1/2" x 1/2") - 80g 1 cup, cooked - 136g
Magnesium
Magnesium
Calcium
Calcium
Potassium
Potassium
Iron
Iron
Copper
Copper
Zinc
Zinc
Phosphorus
Phosphorus
Sodium
Sodium
Manganese
Manganese
Selenium
Selenium
43%
20%
46%
53%
33%
30%
109%
580%
0%
400%
Vitamin Comparison
Vitamin comparison score is based on the number of vitamins by which one or the other food is richer. The "coverage" charts below show how much of the daily needs can be covered by 300 grams of the food.
6
100 g
300 g
0.25 tsp, whole - 0.5g 1 tbsp, whole - 6g
Vitamin C
Vit. C
Vitamin D
Vit. D
Vitamin A
Vit. A
Vitamin E
Vit. E
Vitamin B1
Vit. B1
Vitamin B2
Vit. B2
Vitamin B3
Vit. B3
Vitamin B5
Vit. B5
Vitamin B6
Vit. B6
Vitamin B12
Vit. B12
Vitamin K
Vit. K
Folate
Folate
26%
0%
21%
67%
157%
75%
86%
0%
100%
0%
14%
7.5%
4
100 g
300 g
1 cubic inch, boneless - 17g 1 piece (5-1/2" x 1-1/2" x 1/2") - 80g 1 cup, cooked - 136g
Vitamin C
Vit. C
Vitamin D
Vit. D
Vitamin A
Vit. A
Vitamin E
Vit. E
Vitamin B1
Vit. B1
Vitamin B2
Vit. B2
Vitamin B3
Vit. B3
Vitamin B5
Vit. B5
Vitamin B6
Vit. B6
Vitamin B12
Vit. B12
Vitamin K
Vit. K
Folate
Folate
0%
378%
16%
48%
5%
44%
62%
0%
95%
1500%
20%
11%
All nutrients comparison - raw data values
Nutrient
DV% diff.
Iron
66.36mg
1.4mg
812%
Vitamin B12
0µg
12µg
500%
Sodium
168mg
4450mg
186%
Manganese
3.333mg
145%
Vitamin D*
0 IU
1006 IU
126%
Vitamin D
0µg
25.2µg
126%
Selenium
5.2µg
73.4µg
124%
Calcium
931mg
66mg
87%
Copper
0.867mg
0.1mg
85%
Magnesium
366mg
60mg
73%
Vitamin B1
0.628mg
0.02mg
51%
Fiber
10.5g
0g
42%
Potassium
1788mg
520mg
37%
Phosphorus
499mg
254mg
35%
Zinc
4.8mg
1.1mg
34%
Cholesterol
0mg
95mg
32%
Saturated fat
1.535g
7.148g
26%
Polyunsaturated fat
3.279g
6.21g
20%
Carbs
44.24g
0g
15%
Choline
24.7mg
101.6mg
14%
Monounsaturated fat
14.04g
8.32g
14%
Vitamin B2
0.327mg
0.19mg
11%
Vitamin C
7.7mg
0mg
9%
Vitamin B3
4.579mg
3.3mg
8%
Vitamin E
3.33mg
2.38mg
6%
Calories
375kcal
305kcal
4%
Fats
22.27g
25.1g
4%
Vitamin A
64µg
47µg
2%
Vitamin B6
0.435mg
0.41mg
2%
Vitamin K
5.4µg
7.8µg
2%
Protein
17.81g
18.5g
1%
Folate
10µg
15µg
1%
Protein per 100 calories
4.7g
6.1g
N/A
Calories per 10 g protein
211kcal
165kcal
N/A
Weight per 100 calories
27g
33g
N/A
Unsaturated / Saturated Fat ratio
11
2
N/A
Net carbs
33.74g
0g
N/A
Sugar
2.25g
0g
N/A
Omega-3 - EPA
0g
1.619g
N/A
Omega-3 - DHA
0g
2.965g
N/A
Omega-3 - DPA
0g
0.391g
N/A
Macronutrient Comparison
Macronutrient breakdown side-by-side comparison
1
18%
22%
44%
8%
8%
Protein:
17.81 g
Fats:
22.27 g
Carbs:
44.24 g
Water:
8.06 g
Other:
7.62 g
4
19%
25%
43%
13%
Protein:
18.5 g
Fats:
25.1 g
Carbs:
0 g
Water:
43 g
Other:
13.4 g
Contains
more
Carbs Carbs
+∞%
Contains
more
Fats Fats
+12.7%
Contains
more
Water Water
+433.5%
Contains
more
Other Other
+75.9%
Fat Type Comparison
Fat type breakdown side-by-side comparison
2
8%
74%
17%
Saturated fat:
Sat. Fat
1.535 g
Monounsaturated fat:
Mono. Fat
14.04 g
Polyunsaturated fat:
Poly. Fat
3.279 g
1
33%
38%
29%
Saturated fat:
Sat. Fat
7.148 g
Monounsaturated fat:
Mono. Fat
8.32 g
Polyunsaturated fat:
Poly. Fat
6.21 g
Contains
less
Sat. Fat Saturated fat
-78.5%
Contains
more
Mono. Fat Monounsaturated fat
+68.8%
Contains
more
Poly. Fat Polyunsaturated fat
+89.4%