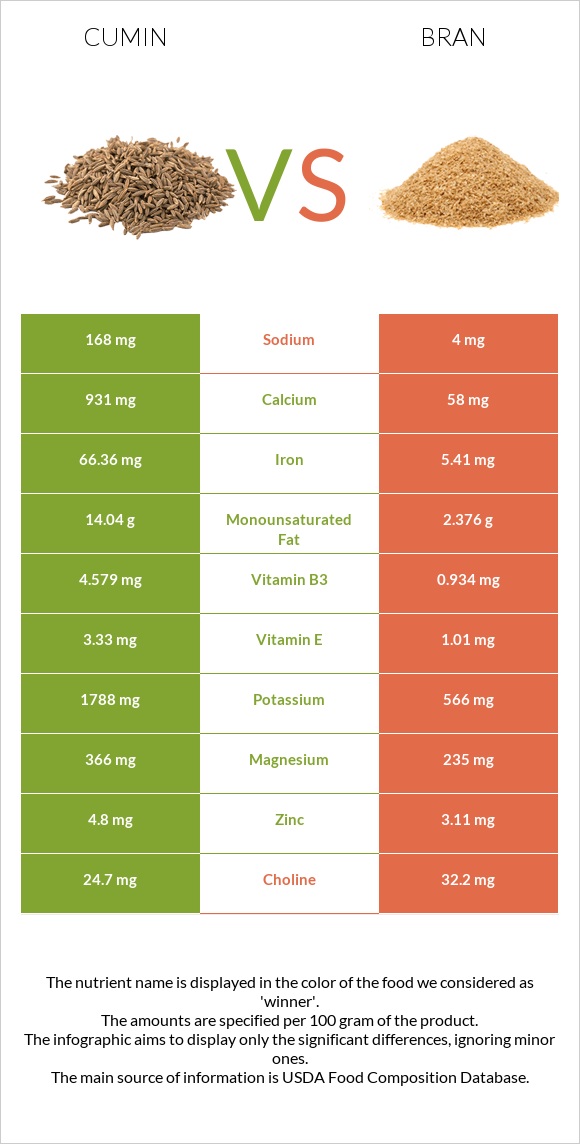
How are cumin and bran different? Cumin is higher than bran in iron, manganese, calcium, copper, magnesium, phosphorus, potassium, vitamin B1, zinc, and fiber. Cumin covers your daily need for iron, 819% more than bran. Cumin contains 93 times more calcium than bran. Cumin contains 931mg of calcium, while bran contains 10mg. Bran has a higher glycemic index (56) than cumin (0). Spices, cumin seed and Oat bran, cooked types were used in this article.
Infographic
Mineral Comparison
Mineral comparison score is based on the number of minerals by which one or the other food is richer. The "coverage" charts below show how much of the daily needs can be covered by 300 grams of the food.
8
100 g
300 g
0.25 tsp, whole - 0.5g 1 tbsp, whole - 6g
Magnesium
Magnesium
Calcium
Calcium
Potassium
Potassium
Iron
Iron
Copper
Copper
Zinc
Zinc
Phosphorus
Phosphorus
Sodium
Sodium
Manganese
Manganese
Selenium
Selenium
261%
279%
158%
2489%
289%
131%
214%
22%
435%
28%
2
100 g
300 g
1 cup - 219g
Magnesium
Magnesium
Calcium
Calcium
Potassium
Potassium
Iron
Iron
Copper
Copper
Zinc
Zinc
Phosphorus
Phosphorus
Sodium
Sodium
Manganese
Manganese
Selenium
Selenium
29%
3%
8.1%
33%
22%
14%
51%
0.13%
126%
42%
Vitamin Comparison
Vitamin comparison score is based on the number of vitamins by which one or the other food is richer. The "coverage" charts below show how much of the daily needs can be covered by 300 grams of the food.
9
100 g
300 g
0.25 tsp, whole - 0.5g 1 tbsp, whole - 6g
Vitamin C
Vit. C
Vitamin D
Vit. D
Vitamin A
Vit. A
Vitamin E
Vit. E
Vitamin B1
Vit. B1
Vitamin B2
Vit. B2
Vitamin B3
Vit. B3
Vitamin B5
Vit. B5
Vitamin B6
Vit. B6
Vitamin B12
Vit. B12
Vitamin K
Vit. K
Folate
Folate
26%
0%
21%
67%
157%
75%
86%
0%
100%
0%
14%
7.5%
1
100 g
300 g
1 cup - 219g
Vitamin C
Vit. C
Vitamin D
Vit. D
Vitamin A
Vit. A
Vitamin E
Vit. E
Vitamin B1
Vit. B1
Vitamin B2
Vit. B2
Vitamin B3
Vit. B3
Vitamin B5
Vit. B5
Vitamin B6
Vit. B6
Vitamin B12
Vit. B12
Vitamin K
Vit. K
Folate
Folate
0%
0%
0%
0%
40%
7.8%
2.7%
13%
5.8%
0%
0%
4.5%
All nutrients comparison - raw data values
Nutrient
DV% diff.
Iron
66.36mg
0.88mg
819%
Manganese
3.333mg
0.964mg
103%
Calcium
931mg
10mg
92%
Copper
0.867mg
0.066mg
89%
Magnesium
366mg
40mg
78%
Phosphorus
499mg
119mg
54%
Potassium
1788mg
92mg
50%
Zinc
4.8mg
0.53mg
39%
Vitamin B1
0.628mg
0.16mg
39%
Monounsaturated fat
14.04g
0.291g
34%
Fats
22.27g
0.86g
33%
Fiber
10.5g
2.6g
32%
Vitamin B6
0.435mg
0.025mg
32%
Protein
17.81g
3.21g
29%
Vitamin B3
4.579mg
0.144mg
28%
Vitamin B2
0.327mg
0.034mg
23%
Vitamin E
3.33mg
22%
Polyunsaturated fat
3.279g
0.339g
20%
Calories
375kcal
40kcal
17%
Carbs
44.24g
11.44g
11%
Vitamin C
7.7mg
0mg
9%
Sodium
168mg
1mg
7%
Vitamin A
64µg
0µg
7%
Saturated fat
1.535g
0.163g
6%
Selenium
5.2µg
7.7µg
5%
Vitamin K
5.4µg
5%
Vitamin B5
0.217mg
4%
Choline
24.7mg
4%
Folate
10µg
6µg
1%
Protein per 100 calories
4.7g
8g
N/A
Calories per 10 g protein
211kcal
125kcal
N/A
Weight per 100 calories
27g
250g
N/A
Unsaturated / Saturated Fat ratio
11
3.9
N/A
Net carbs
33.74g
8.84g
N/A
Sugar
2.25g
N/A
Tryptophan
0.057mg
0%
Threonine
0.086mg
0%
Isoleucine
0.114mg
0%
Leucine
0.235mg
0%
Lysine
0.13mg
0%
Methionine
0.057mg
0%
Phenylalanine
0.155mg
0%
Valine
0.165mg
0%
Histidine
0.07mg
0%
Macronutrient Comparison
Macronutrient breakdown side-by-side comparison
4
18%
22%
44%
8%
8%
Protein:
17.81 g
Fats:
22.27 g
Carbs:
44.24 g
Water:
8.06 g
Other:
7.62 g
1
3%
11%
84%
Protein:
3.21 g
Fats:
0.86 g
Carbs:
11.44 g
Water:
84 g
Other:
0.49 g
Contains
more
Protein Protein
+454.8%
Contains
more
Fats Fats
+2489.5%
Contains
more
Carbs Carbs
+286.7%
Contains
more
Other Other
+1455.1%
Contains
more
Water Water
+942.2%
Fat Type Comparison
Fat type breakdown side-by-side comparison
2
8%
74%
17%
Saturated fat:
Sat. Fat
1.535 g
Monounsaturated fat:
Mono. Fat
14.04 g
Polyunsaturated fat:
Poly. Fat
3.279 g
1
21%
37%
43%
Saturated fat:
Sat. Fat
0.163 g
Monounsaturated fat:
Mono. Fat
0.291 g
Polyunsaturated fat:
Poly. Fat
0.339 g
Contains
more
Mono. Fat Monounsaturated fat
+4724.7%
Contains
more
Poly. Fat Polyunsaturated fat
+867.3%
Contains
less
Sat. Fat Saturated fat
-89.4%