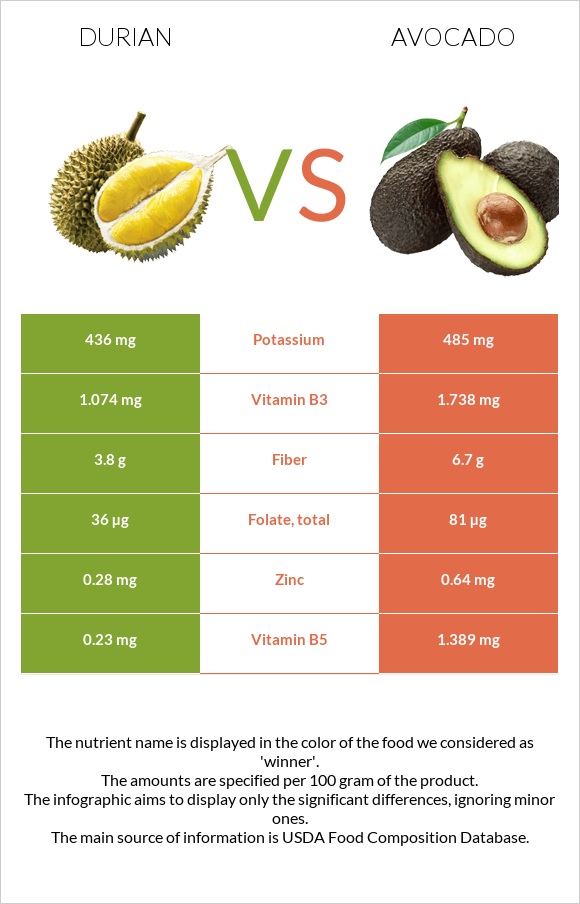
How are durian and avocados different? Durian is higher in vitamin B1, vitamin C, manganese, and vitamin B2; however, avocados are richer in vitamin B5, fiber, and folate. Daily need coverage for vitamin B1 for durian is 26% higher. Durian contains 2 times more manganese than avocados. While durian contains 0.325mg of manganese, avocados contain only 0.142mg. Durian, raw or frozen and Avocados, raw, all commercial varieties are the varieties used in this article.
Infographic
Mineral Comparison
Mineral comparison score is based on the number of minerals by which one or the other food is richer. The "coverage" charts below show how much of the daily needs can be covered by 300 grams of the food.
2
100 g
300 g
1 cup, chopped or diced - 243g 1 fruit - 602g
Magnesium
Magnesium
Calcium
Calcium
Potassium
Potassium
Iron
Iron
Copper
Copper
Zinc
Zinc
Phosphorus
Phosphorus
Sodium
Sodium
Manganese
Manganese
Selenium
Selenium
21%
1.8%
38%
16%
69%
7.6%
17%
0.26%
42%
0%
6
100 g
300 g
1 cup, sliced - 146g 1 cup, cubes - 150g 1 avocado, NS as to Florida or California - 201g 1 cup, pureed - 230g
Magnesium
Magnesium
Calcium
Calcium
Potassium
Potassium
Iron
Iron
Copper
Copper
Zinc
Zinc
Phosphorus
Phosphorus
Sodium
Sodium
Manganese
Manganese
Selenium
Selenium
21%
3.6%
43%
21%
63%
17%
22%
0.91%
19%
2.2%
Vitamin Comparison
Vitamin comparison score is based on the number of vitamins by which one or the other food is richer. The "coverage" charts below show how much of the daily needs can be covered by 300 grams of the food.
4
100 g
300 g
1 cup, chopped or diced - 243g 1 fruit - 602g
Vitamin C
Vit. C
Vitamin D
Vit. D
Vitamin A
Vit. A
Vitamin E
Vit. E
Vitamin B1
Vit. B1
Vitamin B2
Vit. B2
Vitamin B3
Vit. B3
Vitamin B5
Vit. B5
Vitamin B6
Vit. B6
Vitamin B12
Vit. B12
Vitamin K
Vit. K
Folate
Folate
66%
0%
0.67%
0%
94%
46%
20%
14%
73%
0%
0%
27%
6
100 g
300 g
1 cup, sliced - 146g 1 cup, cubes - 150g 1 avocado, NS as to Florida or California - 201g 1 cup, pureed - 230g
Vitamin C
Vit. C
Vitamin D
Vit. D
Vitamin A
Vit. A
Vitamin E
Vit. E
Vitamin B1
Vit. B1
Vitamin B2
Vit. B2
Vitamin B3
Vit. B3
Vitamin B5
Vit. B5
Vitamin B6
Vit. B6
Vitamin B12
Vit. B12
Vitamin K
Vit. K
Folate
Folate
33%
0%
2.3%
41%
17%
30%
33%
83%
59%
0%
53%
61%
All nutrients comparison - raw data values
Nutrient
DV% diff.
Vitamin B1
0.374mg
0.067mg
26%
Monounsaturated fat
9.799g
24%
Vitamin B5
0.23mg
1.389mg
23%
Vitamin K
21µg
18%
Fats
5.33g
14.66g
14%
Vitamin E
2.07mg
14%
Fiber
3.8g
6.7g
12%
Polyunsaturated fat
1.816g
12%
Vitamin C
19.7mg
10mg
11%
Folate
36µg
81µg
11%
Saturated fat
2.126g
10%
Manganese
0.325mg
0.142mg
8%
Carbs
27.09g
8.53g
6%
Vitamin B2
0.2mg
0.13mg
5%
Vitamin B6
0.316mg
0.257mg
5%
Vitamin B3
1.074mg
1.738mg
4%
Zinc
0.28mg
0.64mg
3%
Choline
14.2mg
3%
Iron
0.43mg
0.55mg
2%
Copper
0.207mg
0.19mg
2%
Phosphorus
39mg
52mg
2%
Calories
147kcal
160kcal
1%
Protein
1.47g
2g
1%
Calcium
6mg
12mg
1%
Potassium
436mg
485mg
1%
Vitamin A
2µg
7µg
1%
Selenium
0.4µg
1%
Protein per 100 calories
1g
1.3g
N/A
Calories per 10 g protein
1000kcal
800kcal
N/A
Weight per 100 calories
68g
63g
N/A
Unsaturated / Saturated Fat ratio
5.5
N/A
Net carbs
23.29g
1.83g
N/A
Magnesium
30mg
29mg
0%
Sugar
0.66g
N/A
Starch
0.11g
0%
Sodium
2mg
7mg
0%
Tryptophan
0.025mg
0%
Threonine
0.073mg
0%
Isoleucine
0.084mg
0%
Leucine
0.143mg
0%
Lysine
0.132mg
0%
Methionine
0.038mg
0%
Phenylalanine
0.097mg
0%
Valine
0.107mg
0%
Histidine
0.049mg
0%
Fructose
0.12g
0%
Omega-3 - ALA
0.111g
N/A
Omega-6 - Gamma-linoleic acid
0.015g
N/A
Macronutrient Comparison
Macronutrient breakdown side-by-side comparison
1
5%
27%
65%
Protein:
1.47 g
Fats:
5.33 g
Carbs:
27.09 g
Water:
64.99 g
Other:
1.12 g
4
2%
15%
9%
73%
Protein:
2 g
Fats:
14.66 g
Carbs:
8.53 g
Water:
73.23 g
Other:
1.58 g
Contains
more
Carbs Carbs
+217.6%
Contains
more
Protein Protein
+36.1%
Contains
more
Fats Fats
+175%
Contains
more
Water Water
+12.7%
Contains
more
Other Other
+41.1%