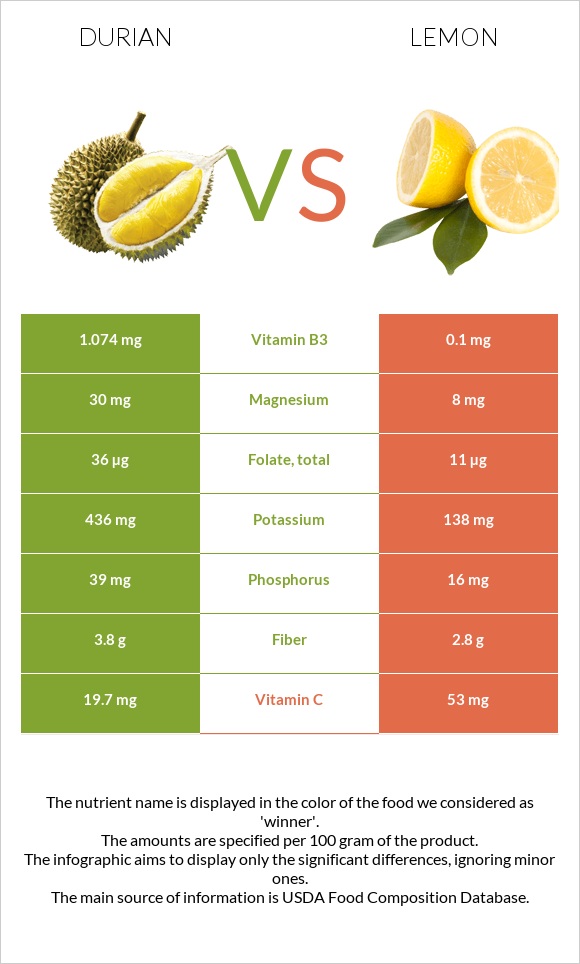
Important differences between durian and lemons Durian has more vitamin B1, copper, vitamin B6, vitamin B2, manganese, potassium, folate, vitamin B3, and magnesium; however, lemons are richer in vitamin C. Lemons' daily need coverage for vitamin C is 37% more. Durian contains 11 times more manganese than lemons. Durian contains 0.325mg of manganese, while lemons contain 0.03mg. The food varieties used in the comparison are Durian, raw or frozen and Lemons, raw, without peel .
Infographic
Mineral Comparison
Mineral comparison score is based on the number of minerals by which one or the other food is richer. The "coverage" charts below show how much of the daily needs can be covered by 300 grams of the food.
6
100 g
300 g
1 cup, chopped or diced - 243g 1 fruit - 602g
Magnesium
Magnesium
Calcium
Calcium
Potassium
Potassium
Iron
Iron
Copper
Copper
Zinc
Zinc
Phosphorus
Phosphorus
Sodium
Sodium
Manganese
Manganese
Selenium
Selenium
21%
1.8%
38%
16%
69%
7.6%
17%
0.26%
42%
0%
3
100 g
300 g
1 wedge or slice (1/8 of one 2-1/8" dia lemon) - 7g 1 fruit (2-1/8" dia) - 58g 1 NLEA serving - 58g 1 fruit (2-3/8" dia) - 84g 1 cup, sections - 212g
Magnesium
Magnesium
Calcium
Calcium
Potassium
Potassium
Iron
Iron
Copper
Copper
Zinc
Zinc
Phosphorus
Phosphorus
Sodium
Sodium
Manganese
Manganese
Selenium
Selenium
5.7%
7.8%
12%
23%
12%
1.6%
6.9%
0.26%
3.9%
2.2%
Vitamin Comparison
Vitamin comparison score is based on the number of vitamins by which one or the other food is richer. The "coverage" charts below show how much of the daily needs can be covered by 300 grams of the food.
7
100 g
300 g
1 cup, chopped or diced - 243g 1 fruit - 602g
Vitamin C
Vit. C
Vitamin D
Vit. D
Vitamin A
Vit. A
Vitamin E
Vit. E
Vitamin B1
Vit. B1
Vitamin B2
Vit. B2
Vitamin B3
Vit. B3
Vitamin B5
Vit. B5
Vitamin B6
Vit. B6
Vitamin B12
Vit. B12
Vitamin K
Vit. K
Folate
Folate
66%
0%
0.67%
0%
94%
46%
20%
14%
73%
0%
0%
27%
2
100 g
300 g
1 wedge or slice (1/8 of one 2-1/8" dia lemon) - 7g 1 fruit (2-1/8" dia) - 58g 1 NLEA serving - 58g 1 fruit (2-3/8" dia) - 84g 1 cup, sections - 212g
Vitamin C
Vit. C
Vitamin D
Vit. D
Vitamin A
Vit. A
Vitamin E
Vit. E
Vitamin B1
Vit. B1
Vitamin B2
Vit. B2
Vitamin B3
Vit. B3
Vitamin B5
Vit. B5
Vitamin B6
Vit. B6
Vitamin B12
Vit. B12
Vitamin K
Vit. K
Folate
Folate
177%
0%
0.33%
3%
10%
4.6%
1.9%
11%
18%
0%
0%
8.3%
All nutrients comparison - raw data values
Nutrient
DV% diff.
Vitamin C
19.7mg
53mg
37%
Vitamin B1
0.374mg
0.04mg
28%
Copper
0.207mg
0.037mg
19%
Vitamin B6
0.316mg
0.08mg
18%
Vitamin B2
0.2mg
0.02mg
14%
Manganese
0.325mg
0.03mg
13%
Potassium
436mg
138mg
9%
Fats
5.33g
0.3g
8%
Calories
147kcal
29kcal
6%
Carbs
27.09g
9.32g
6%
Vitamin B3
1.074mg
0.1mg
6%
Folate
36µg
11µg
6%
Magnesium
30mg
8mg
5%
Fiber
3.8g
2.8g
4%
Phosphorus
39mg
16mg
3%
Calcium
6mg
26mg
2%
Iron
0.43mg
0.6mg
2%
Zinc
0.28mg
0.06mg
2%
Protein
1.47g
1.1g
1%
Vitamin E
0.15mg
1%
Selenium
0.4µg
1%
Vitamin B5
0.23mg
0.19mg
1%
Choline
5.1mg
1%
Polyunsaturated fat
0.089g
1%
Protein per 100 calories
1g
3.8g
N/A
Calories per 10 g protein
1000kcal
264kcal
N/A
Weight per 100 calories
68g
345g
N/A
Unsaturated / Saturated Fat ratio
2.6
N/A
Net carbs
23.29g
6.52g
N/A
Sugar
2.5g
N/A
Sodium
2mg
2mg
0%
Vitamin A
2µg
1µg
0%
Saturated fat
0.039g
0%
Monounsaturated fat
0.011g
0%
Macronutrient Comparison
Macronutrient breakdown side-by-side comparison
4
5%
27%
65%
Protein:
1.47 g
Fats:
5.33 g
Carbs:
27.09 g
Water:
64.99 g
Other:
1.12 g
1
9%
89%
Protein:
1.1 g
Fats:
0.3 g
Carbs:
9.32 g
Water:
88.98 g
Other:
0.3 g
Contains
more
Protein Protein
+33.6%
Contains
more
Fats Fats
+1676.7%
Contains
more
Carbs Carbs
+190.7%
Contains
more
Other Other
+273.3%
Contains
more
Water Water
+36.9%