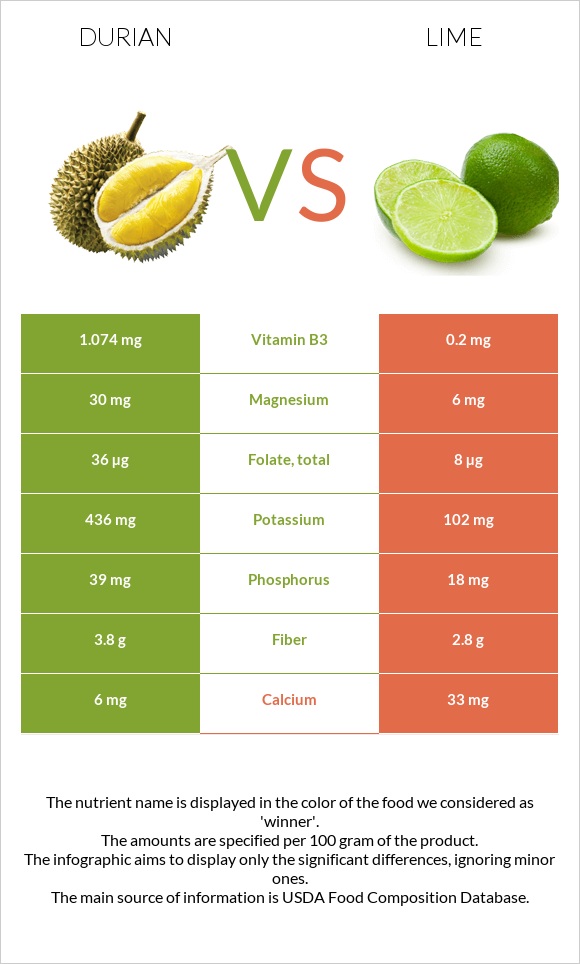
Differences between durian and lime Durian has more vitamin B1, vitamin B6, copper, vitamin B2, manganese, potassium, folate, magnesium, and vitamin B3, while lime has more vitamin C. Durian's daily need coverage for vitamin B1 is 29% higher. Lime contains 41 times less manganese than durian. Durian contains 0.325mg of manganese, while lime contains 0.008mg. Lime has a lower glycemic index. The glycemic index of lime is 32, while the glycemic index of durian is 49. The food types used in this comparison are Durian, raw or frozen and Limes, raw .
Infographic
Mineral Comparison
Mineral comparison score is based on the number of minerals by which one or the other food is richer. The "coverage" charts below show how much of the daily needs can be covered by 300 grams of the food.
6
100 g
300 g
1 cup, chopped or diced - 243g 1 fruit - 602g
Magnesium
Magnesium
Calcium
Calcium
Potassium
Potassium
Iron
Iron
Copper
Copper
Zinc
Zinc
Phosphorus
Phosphorus
Sodium
Sodium
Manganese
Manganese
Selenium
Selenium
21%
1.8%
38%
16%
69%
7.6%
17%
0.26%
42%
0%
3
100 g
300 g
1 fruit (2" dia) - 67g 1 NLEA serving - 67g
Magnesium
Magnesium
Calcium
Calcium
Potassium
Potassium
Iron
Iron
Copper
Copper
Zinc
Zinc
Phosphorus
Phosphorus
Sodium
Sodium
Manganese
Manganese
Selenium
Selenium
4.3%
9.9%
9%
23%
22%
3%
7.7%
0.26%
1%
2.2%
Vitamin Comparison
Vitamin comparison score is based on the number of vitamins by which one or the other food is richer. The "coverage" charts below show how much of the daily needs can be covered by 300 grams of the food.
5
100 g
300 g
1 cup, chopped or diced - 243g 1 fruit - 602g
Vitamin C
Vit. C
Vitamin D
Vit. D
Vitamin A
Vit. A
Vitamin E
Vit. E
Vitamin B1
Vit. B1
Vitamin B2
Vit. B2
Vitamin B3
Vit. B3
Vitamin B5
Vit. B5
Vitamin B6
Vit. B6
Vitamin B12
Vit. B12
Vitamin K
Vit. K
Folate
Folate
66%
0%
0.67%
0%
94%
46%
20%
14%
73%
0%
0%
27%
3
100 g
300 g
1 fruit (2" dia) - 67g 1 NLEA serving - 67g
Vitamin C
Vit. C
Vitamin D
Vit. D
Vitamin A
Vit. A
Vitamin E
Vit. E
Vitamin B1
Vit. B1
Vitamin B2
Vit. B2
Vitamin B3
Vit. B3
Vitamin B5
Vit. B5
Vitamin B6
Vit. B6
Vitamin B12
Vit. B12
Vitamin K
Vit. K
Folate
Folate
97%
0%
0.67%
4.4%
7.5%
4.6%
3.8%
13%
9.9%
0%
1.5%
6%
All nutrients comparison - raw data values
Nutrient
DV% diff.
Vitamin B1
0.374mg
0.03mg
29%
Vitamin B6
0.316mg
0.043mg
21%
Copper
0.207mg
0.065mg
16%
Manganese
0.325mg
0.008mg
14%
Vitamin B2
0.2mg
0.02mg
14%
Vitamin C
19.7mg
29.1mg
10%
Potassium
436mg
102mg
10%
Fats
5.33g
0.2g
8%
Folate
36µg
8µg
7%
Calories
147kcal
30kcal
6%
Carbs
27.09g
10.54g
6%
Magnesium
30mg
6mg
6%
Vitamin B3
1.074mg
0.2mg
5%
Fiber
3.8g
2.8g
4%
Calcium
6mg
33mg
3%
Phosphorus
39mg
18mg
3%
Protein
1.47g
0.7g
2%
Iron
0.43mg
0.6mg
2%
Zinc
0.28mg
0.11mg
2%
Vitamin E
0.22mg
1%
Selenium
0.4µg
1%
Vitamin K
0.6µg
1%
Choline
5.1mg
1%
Protein per 100 calories
1g
2.3g
N/A
Calories per 10 g protein
1000kcal
429kcal
N/A
Weight per 100 calories
68g
333g
N/A
Unsaturated / Saturated Fat ratio
3.4
N/A
Net carbs
23.29g
7.74g
N/A
Sugar
1.69g
N/A
Sodium
2mg
2mg
0%
Vitamin A
2µg
2µg
0%
Vitamin B5
0.23mg
0.217mg
0%
Saturated fat
0.022g
0%
Monounsaturated fat
0.019g
0%
Polyunsaturated fat
0.055g
0%
Tryptophan
0.003mg
0%
Lysine
0.014mg
0%
Methionine
0.002mg
0%
Macronutrient Comparison
Macronutrient breakdown side-by-side comparison
4
5%
27%
65%
Protein:
1.47 g
Fats:
5.33 g
Carbs:
27.09 g
Water:
64.99 g
Other:
1.12 g
1
11%
88%
Protein:
0.7 g
Fats:
0.2 g
Carbs:
10.54 g
Water:
88.26 g
Other:
0.3 g
Contains
more
Protein Protein
+110%
Contains
more
Fats Fats
+2565%
Contains
more
Carbs Carbs
+157%
Contains
more
Other Other
+273.3%
Contains
more
Water Water
+35.8%