How are durian and pineapple different? Durian is richer in vitamin B1, vitamin B6, vitamin B2, copper, potassium, and fiber, while pineapple is higher in vitamin C and manganese. Pineapple covers your daily need for vitamin C, 31% more than durian. Durian contains 6 times more vitamin B2 than pineapple. Durian contains 0.2mg of vitamin B2, while pineapple contains 0.032mg. Pineapple has a higher glycemic index (66) than durian (49). Durian, raw or frozen and Pineapple, raw, all varieties types were used in this article.
Infographic
Mineral Comparison
Mineral comparison score is based on the number of minerals by which one or the other food is richer. The "coverage" charts below show how much of the daily needs can be covered by 300 grams of the food.
6
100 g
300 g
1 cup, chopped or diced - 243g 1 fruit - 602g
Magnesium
Magnesium
Calcium
Calcium
Potassium
Potassium
Iron
Iron
Copper
Copper
Zinc
Zinc
Phosphorus
Phosphorus
Sodium
Sodium
Manganese
Manganese
Selenium
Selenium
21%
1.8%
38%
16%
69%
7.6%
17%
0.26%
42%
0%
4
100 g
300 g
1 slice, thin (3-1/2" dia x 1/2" thick) - 56g 1 slice (3-1/2" dia x 3/4" thick) - 84g 1 cup, chunks - 165g 1 slice (4-2/3" dia x 3/4" thick) - 166g 1 fruit - 905g
Magnesium
Magnesium
Calcium
Calcium
Potassium
Potassium
Iron
Iron
Copper
Copper
Zinc
Zinc
Phosphorus
Phosphorus
Sodium
Sodium
Manganese
Manganese
Selenium
Selenium
8.6%
3.9%
9.6%
11%
37%
3.3%
3.4%
0.13%
121%
0.55%
Vitamin Comparison
Vitamin comparison score is based on the number of vitamins by which one or the other food is richer. The "coverage" charts below show how much of the daily needs can be covered by 300 grams of the food.
5
100 g
300 g
1 cup, chopped or diced - 243g 1 fruit - 602g
Vitamin C
Vit. C
Vitamin D
Vit. D
Vitamin A
Vit. A
Vitamin E
Vit. E
Vitamin B1
Vit. B1
Vitamin B2
Vit. B2
Vitamin B3
Vit. B3
Vitamin B5
Vit. B5
Vitamin B6
Vit. B6
Vitamin B12
Vit. B12
Vitamin K
Vit. K
Folate
Folate
66%
0%
0.67%
0%
94%
46%
20%
14%
73%
0%
0%
27%
4
100 g
300 g
1 slice, thin (3-1/2" dia x 1/2" thick) - 56g 1 slice (3-1/2" dia x 3/4" thick) - 84g 1 cup, chunks - 165g 1 slice (4-2/3" dia x 3/4" thick) - 166g 1 fruit - 905g
Vitamin C
Vit. C
Vitamin D
Vit. D
Vitamin A
Vit. A
Vitamin E
Vit. E
Vitamin B1
Vit. B1
Vitamin B2
Vit. B2
Vitamin B3
Vit. B3
Vitamin B5
Vit. B5
Vitamin B6
Vit. B6
Vitamin B12
Vit. B12
Vitamin K
Vit. K
Folate
Folate
159%
0%
1%
0.4%
20%
7.4%
9.4%
13%
26%
0%
1.8%
14%
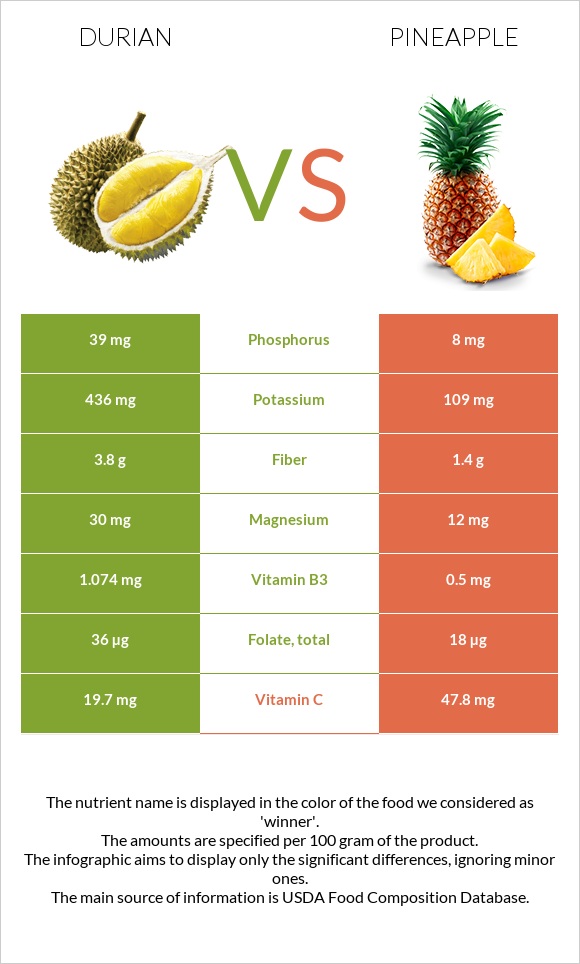
All nutrients comparison - raw data values
Nutrient
DV% diff.
Vitamin C
19.7mg
47.8mg
31%
Manganese
0.325mg
0.927mg
26%
Vitamin B1
0.374mg
0.079mg
25%
Vitamin B6
0.316mg
0.112mg
16%
Vitamin B2
0.2mg
0.032mg
13%
Copper
0.207mg
0.11mg
11%
Potassium
436mg
109mg
10%
Fiber
3.8g
1.4g
10%
Fats
5.33g
0.12g
8%
Calories
147kcal
50kcal
5%
Carbs
27.09g
13.12g
5%
Folate
36µg
18µg
5%
Magnesium
30mg
12mg
4%
Phosphorus
39mg
8mg
4%
Vitamin B3
1.074mg
0.5mg
4%
Fructose
2.12g
3%
Protein
1.47g
0.54g
2%
Iron
0.43mg
0.29mg
2%
Calcium
6mg
13mg
1%
Zinc
0.28mg
0.12mg
1%
Vitamin K
0.7µg
1%
Choline
5.5mg
1%
Protein per 100 calories
1g
1.1g
N/A
Calories per 10 g protein
1000kcal
926kcal
N/A
Weight per 100 calories
68g
200g
N/A
Unsaturated / Saturated Fat ratio
5.9
N/A
Net carbs
23.29g
11.72g
N/A
Sugar
9.85g
N/A
Sodium
2mg
1mg
0%
Vitamin A
2µg
3µg
0%
Vitamin E
0.02mg
0%
Selenium
0.1µg
0%
Vitamin B5
0.23mg
0.213mg
0%
Saturated fat
0.009g
0%
Monounsaturated fat
0.013g
0%
Polyunsaturated fat
0.04g
0%
Tryptophan
0.005mg
0%
Threonine
0.019mg
0%
Isoleucine
0.019mg
0%
Leucine
0.024mg
0%
Lysine
0.026mg
0%
Methionine
0.012mg
0%
Phenylalanine
0.021mg
0%
Valine
0.024mg
0%
Histidine
0.01mg
0%
Macronutrient Comparison
Macronutrient breakdown side-by-side comparison
4
5%
27%
65%
Protein:
1.47 g
Fats:
5.33 g
Carbs:
27.09 g
Water:
64.99 g
Other:
1.12 g
1
13%
86%
Protein:
0.54 g
Fats:
0.12 g
Carbs:
13.12 g
Water:
86 g
Other:
0.22 g
Contains
more
Protein Protein
+172.2%
Contains
more
Fats Fats
+4341.7%
Contains
more
Carbs Carbs
+106.5%
Contains
more
Other Other
+409.1%
Contains
more
Water Water
+32.3%