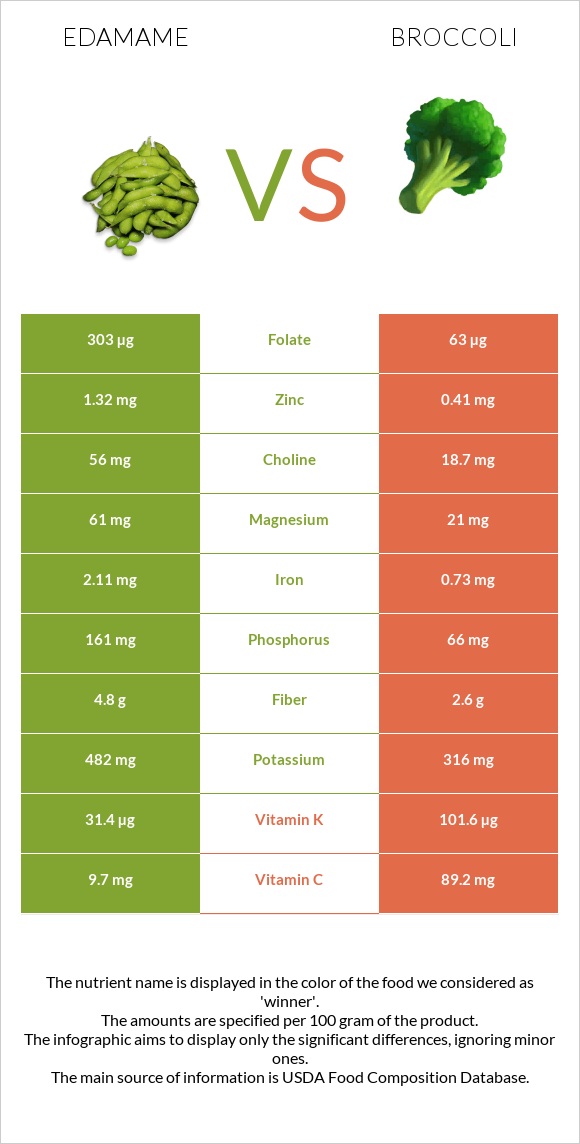
Important differences between edamame and broccoli Edamame has more folate, manganese, copper, iron, phosphorus, vitamin B1, fiber, and magnesium; however, broccoli is richer in vitamin C and vitamin K. Broccoli's daily need coverage for vitamin C is 92% more. Edamame contains 7 times more copper than broccoli. Edamame contains 0.345mg of copper, while broccoli contains 0.049mg. The food varieties used in the comparison are Edamame, frozen, prepared and Broccoli, raw .
Infographic
Mineral Comparison
Mineral comparison score is based on the number of minerals by which one or the other food is richer. The "coverage" charts below show how much of the daily needs can be covered by 300 grams of the food.
9
100 g
300 g
1 cup - 155g
Magnesium
Magnesium
Calcium
Calcium
Potassium
Potassium
Iron
Iron
Copper
Copper
Zinc
Zinc
Phosphorus
Phosphorus
Sodium
Sodium
Manganese
Manganese
Selenium
Selenium
46%
19%
38%
85%
115%
37%
72%
0.78%
134%
4.4%
1
100 g
300 g
1 spear (about 5" long) - 31g 0.5 cup, chopped or diced - 44g 1 cup chopped - 91g 1 NLEA serving - 148g 1 stalk - 151g 1 bunch - 608g
Magnesium
Magnesium
Calcium
Calcium
Potassium
Potassium
Iron
Iron
Copper
Copper
Zinc
Zinc
Phosphorus
Phosphorus
Sodium
Sodium
Manganese
Manganese
Selenium
Selenium
15%
14%
28%
27%
16%
11%
28%
4.3%
27%
14%
Vitamin Comparison
Vitamin comparison score is based on the number of vitamins by which one or the other food is richer. The "coverage" charts below show how much of the daily needs can be covered by 300 grams of the food.
4
100 g
300 g
1 cup - 155g
Vitamin C
Vit. C
Vitamin D
Vit. D
Vitamin A
Vit. A
Vitamin E
Vit. E
Vitamin B1
Vit. B1
Vitamin B2
Vit. B2
Vitamin B3
Vit. B3
Vitamin B5
Vit. B5
Vitamin B6
Vit. B6
Vitamin B12
Vit. B12
Vitamin K
Vit. K
Folate
Folate
20%
0%
5%
14%
50%
36%
17%
24%
23%
0%
67%
233%
6
100 g
300 g
1 spear (about 5" long) - 31g 0.5 cup, chopped or diced - 44g 1 cup chopped - 91g 1 NLEA serving - 148g 1 stalk - 151g 1 bunch - 608g
Vitamin C
Vit. C
Vitamin D
Vit. D
Vitamin A
Vit. A
Vitamin E
Vit. E
Vitamin B1
Vit. B1
Vitamin B2
Vit. B2
Vitamin B3
Vit. B3
Vitamin B5
Vit. B5
Vitamin B6
Vit. B6
Vitamin B12
Vit. B12
Vitamin K
Vit. K
Folate
Folate
297%
0%
10%
16%
18%
27%
12%
34%
40%
0%
254%
47%
All nutrients comparison - raw data values
Nutrient
DV% diff.
Vitamin C
6.1mg
89.2mg
92%
Vitamin K
26.7µg
101.6µg
62%
Folate
311µg
63µg
62%
Manganese
1.024mg
0.21mg
35%
Copper
0.345mg
0.049mg
33%
Iron
2.27mg
0.73mg
19%
Protein
11.91g
2.82g
18%
Phosphorus
169mg
66mg
15%
Polyunsaturated fat
2.156g
0.038g
14%
Vitamin B1
0.2mg
0.071mg
11%
Magnesium
64mg
21mg
10%
Fiber
5.2g
2.6g
10%
Zinc
1.37mg
0.41mg
9%
Fats
5.2g
0.37g
7%
Choline
56.3mg
18.7mg
7%
Vitamin B6
0.1mg
0.175mg
6%
Calories
121kcal
34kcal
4%
Potassium
436mg
316mg
4%
Vitamin B5
0.395mg
0.573mg
4%
Selenium
0.8µg
2.5µg
3%
Vitamin B2
0.155mg
0.117mg
3%
Saturated fat
0.62g
0.039g
3%
Monounsaturated fat
1.282g
0.011g
3%
Calcium
63mg
47mg
2%
Vitamin A
15µg
31µg
2%
Vitamin B3
0.915mg
0.639mg
2%
Carbs
8.91g
6.64g
1%
Starch
1.51g
0g
1%
Sodium
6mg
33mg
1%
Vitamin E
0.68mg
0.78mg
1%
Fructose
0.12g
0.68g
1%
Protein per 100 calories
9.8g
8.3g
N/A
Calories per 10 g protein
102kcal
121kcal
N/A
Weight per 100 calories
83g
294g
N/A
Unsaturated / Saturated Fat ratio
5.5
1.3
N/A
Net carbs
3.71g
4.04g
N/A
Sugar
2.18g
1.7g
N/A
Trans fat
0.009g
0g
N/A
Tryptophan
0.126mg
0.033mg
0%
Threonine
0.331mg
0.088mg
0%
Isoleucine
0.3mg
0.079mg
0%
Leucine
0.745mg
0.129mg
0%
Lysine
0.745mg
0.135mg
0%
Methionine
0.141mg
0.038mg
0%
Phenylalanine
0.488mg
0.117mg
0%
Valine
0.324mg
0.125mg
0%
Histidine
0.267mg
0.059mg
0%
Omega-3 - EPA
0.003g
0g
N/A
Omega-3 - ALA
0.358g
N/A
Omega-6 - Eicosadienoic acid
0.002g
0g
N/A
Omega-6 - Linoleic acid
1.789g
N/A
Macronutrient Comparison
Macronutrient breakdown side-by-side comparison
4
12%
5%
9%
73%
Protein:
11.91 g
Fats:
5.2 g
Carbs:
8.91 g
Water:
72.77 g
Other:
1.21 g
1
3%
7%
89%
Protein:
2.82 g
Fats:
0.37 g
Carbs:
6.64 g
Water:
89.3 g
Other:
0.87 g
Contains
more
Protein Protein
+322.3%
Contains
more
Fats Fats
+1305.4%
Contains
more
Carbs Carbs
+34.2%
Contains
more
Other Other
+39.1%
Contains
more
Water Water
+22.7%
Fat Type Comparison
Fat type breakdown side-by-side comparison
2
15%
32%
53%
Saturated fat:
Sat. Fat
0.62 g
Monounsaturated fat:
Mono. Fat
1.282 g
Polyunsaturated fat:
Poly. Fat
2.156 g
1
44%
13%
43%
Saturated fat:
Sat. Fat
0.039 g
Monounsaturated fat:
Mono. Fat
0.011 g
Polyunsaturated fat:
Poly. Fat
0.038 g
Contains
more
Mono. Fat Monounsaturated fat
+11554.5%
Contains
more
Poly. Fat Polyunsaturated fat
+5573.7%
Contains
less
Sat. Fat Saturated fat
-93.7%
Carbohydrate type comparison
Carbohydrate type breakdown side-by-side comparison
3
41%
30%
3%
26%
Starch:
1.51 g
Sucrose:
1.12 g
Glucose:
0 g
Fructose:
0.12 g
Lactose:
0 g
Maltose:
0.95 g
Galactose:
0 g
3
6%
29%
40%
12%
12%
Starch:
0 g
Sucrose:
0.1 g
Glucose:
0.49 g
Fructose:
0.68 g
Lactose:
0.21 g
Maltose:
0.21 g
Galactose:
0 g
Contains
more
Starch Starch
+∞%
Contains
more
Sucrose Sucrose
+1020%
Contains
more
Maltose Maltose
+352.4%
Contains
more
Glucose Glucose
+∞%
Contains
more
Fructose Fructose
+466.7%
Contains
more
Lactose Lactose
+∞%