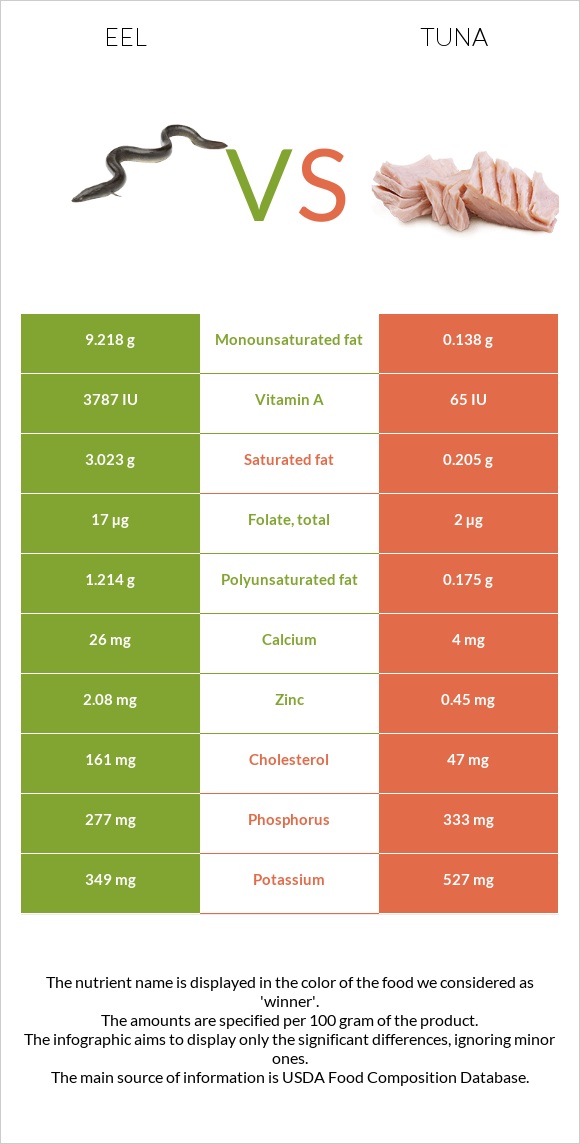
What are the differences between eels and tuna? Eels are higher in vitamin A, vitamin B12, and zinc, yet tuna is higher in selenium, vitamin B3, vitamin B6, phosphorus, and vitamin B2. Tuna's daily need coverage for selenium is 182% more. Eels have 58 times more vitamin A than tuna. While eels have 3787 IU of vitamin A, tuna has only 65 IU. The amount of saturated fat in tuna is lower. We used Fish, eel, mixed species, cooked, dry heat and Fish, tuna, yellowfin, fresh, cooked, dry heat types in this article.
Infographic
Mineral Comparison
Mineral comparison score is based on the number of minerals by which one or the other food is richer. The "coverage" charts below show how much of the daily needs can be covered by 300 grams of the food.
3
100 g
300 g
1 cubic inch, boneless - 17g 1 oz with bone (yield after bone removed) - 22g 1 oz, boneless - 28.35g 3 oz - 85g 1 fillet - 159g
Magnesium
Magnesium
Calcium
Calcium
Potassium
Potassium
Iron
Iron
Copper
Copper
Zinc
Zinc
Phosphorus
Phosphorus
Sodium
Sodium
Manganese
Manganese
Selenium
Selenium
19%
7.8%
31%
24%
9.7%
57%
119%
8.5%
5.2%
45%
7
100 g
300 g
3 oz - 85g
Magnesium
Magnesium
Calcium
Calcium
Potassium
Potassium
Iron
Iron
Copper
Copper
Zinc
Zinc
Phosphorus
Phosphorus
Sodium
Sodium
Manganese
Manganese
Selenium
Selenium
30%
1.2%
47%
35%
14%
12%
143%
7%
1.7%
590%
Vitamin Comparison
Vitamin comparison score is based on the number of vitamins by which one or the other food is richer. The "coverage" charts below show how much of the daily needs can be covered by 300 grams of the food.
5
100 g
300 g
1 cubic inch, boneless - 17g 1 oz with bone (yield after bone removed) - 22g 1 oz, boneless - 28.35g 3 oz - 85g 1 fillet - 159g
Vitamin C
Vit. C
Vitamin D
Vit. D
Vitamin A
Vit. A
Vitamin E
Vit. E
Vitamin B1
Vit. B1
Vitamin B2
Vit. B2
Vitamin B3
Vit. B3
Vitamin B5
Vit. B5
Vitamin B6
Vit. B6
Vitamin B12
Vit. B12
Vitamin K
Vit. K
Folate
Folate
6%
0%
379%
0%
46%
12%
84%
17%
18%
361%
0%
13%
7
100 g
300 g
3 oz - 85g
Vitamin C
Vit. C
Vitamin D
Vit. D
Vitamin A
Vit. A
Vitamin E
Vit. E
Vitamin B1
Vit. B1
Vitamin B2
Vit. B2
Vitamin B3
Vit. B3
Vitamin B5
Vit. B5
Vitamin B6
Vit. B6
Vitamin B12
Vit. B12
Vitamin K
Vit. K
Folate
Folate
0%
30%
7.3%
5.8%
34%
32%
414%
20%
240%
294%
0.25%
1.5%
All nutrients comparison - raw data values
Nutrient
DV% diff.
Selenium
8.3µg
108.2µg
182%
Vitamin A
1137µg
22µg
124%
Vitamin B3
4.487mg
22.07mg
110%
Vitamin B6
0.077mg
1.038mg
74%
Cholesterol
161mg
47mg
38%
Vitamin B12
2.89µg
2.35µg
23%
Monounsaturated fat
9.218g
0.138g
23%
Fats
14.95g
0.59g
22%
Zinc
2.08mg
0.45mg
15%
Choline
77.6mg
14%
Saturated fat
3.023g
0.205g
13%
Protein
23.65g
29.15g
11%
Vitamin D*
82 IU
10%
Vitamin D
2µg
10%
Phosphorus
277mg
333mg
8%
Vitamin B2
0.051mg
0.137mg
7%
Polyunsaturated fat
1.214g
0.175g
7%
Calories
236kcal
130kcal
5%
Potassium
349mg
527mg
5%
Magnesium
26mg
42mg
4%
Iron
0.64mg
0.92mg
4%
Vitamin B1
0.183mg
0.134mg
4%
Folate
17µg
2µg
4%
Vitamin C
1.8mg
0mg
2%
Calcium
26mg
4mg
2%
Copper
0.029mg
0.043mg
2%
Vitamin E
0.29mg
2%
Manganese
0.04mg
0.013mg
1%
Vitamin B5
0.28mg
0.334mg
1%
Protein per 100 calories
10g
22g
N/A
Calories per 10 g protein
100kcal
45kcal
N/A
Weight per 100 calories
42g
77g
N/A
Unsaturated / Saturated Fat ratio
3.5
1.5
N/A
Sodium
65mg
54mg
0%
Vitamin K
0.1µg
0%
Trans fat
0.02g
N/A
Tryptophan
0.265mg
0.313mg
0%
Threonine
1.037mg
1.224mg
0%
Isoleucine
1.09mg
1.287mg
0%
Leucine
1.922mg
2.27mg
0%
Lysine
2.171mg
2.565mg
0%
Methionine
0.7mg
0.827mg
0%
Phenylalanine
0.923mg
1.091mg
0%
Valine
1.218mg
1.438mg
0%
Histidine
0.696mg
0.822mg
0%
Omega-3 - EPA
0.108g
0.015g
N/A
Omega-3 - DHA
0.081g
0.105g
N/A
Omega-3 - DPA
0.095g
0.005g
N/A
Omega-6 - Eicosadienoic acid
0.002g
N/A
Macronutrient Comparison
Macronutrient breakdown side-by-side comparison
2
24%
15%
59%
2%
Protein:
23.65 g
Fats:
14.95 g
Carbs:
0 g
Water:
59.31 g
Other:
2.09 g
2
29%
69%
Protein:
29.15 g
Fats:
0.59 g
Carbs:
0 g
Water:
68.98 g
Other:
1.28 g
Contains
more
Fats Fats
+2433.9%
Contains
more
Other Other
+63.3%
Contains
more
Protein Protein
+23.3%
Contains
more
Water Water
+16.3%
Fat Type Comparison
Fat type breakdown side-by-side comparison
2
22%
69%
9%
Saturated fat:
Sat. Fat
3.023 g
Monounsaturated fat:
Mono. Fat
9.218 g
Polyunsaturated fat:
Poly. Fat
1.214 g
1
40%
27%
34%
Saturated fat:
Sat. Fat
0.205 g
Monounsaturated fat:
Mono. Fat
0.138 g
Polyunsaturated fat:
Poly. Fat
0.175 g
Contains
more
Mono. Fat Monounsaturated fat
+6579.7%
Contains
more
Poly. Fat Polyunsaturated fat
+593.7%
Contains
less
Sat. Fat Saturated fat
-93.2%