English muffins, plain, enriched, with ca prop (includes sourdough) vs. Dough — In-Depth Nutrition Comparison
Compare
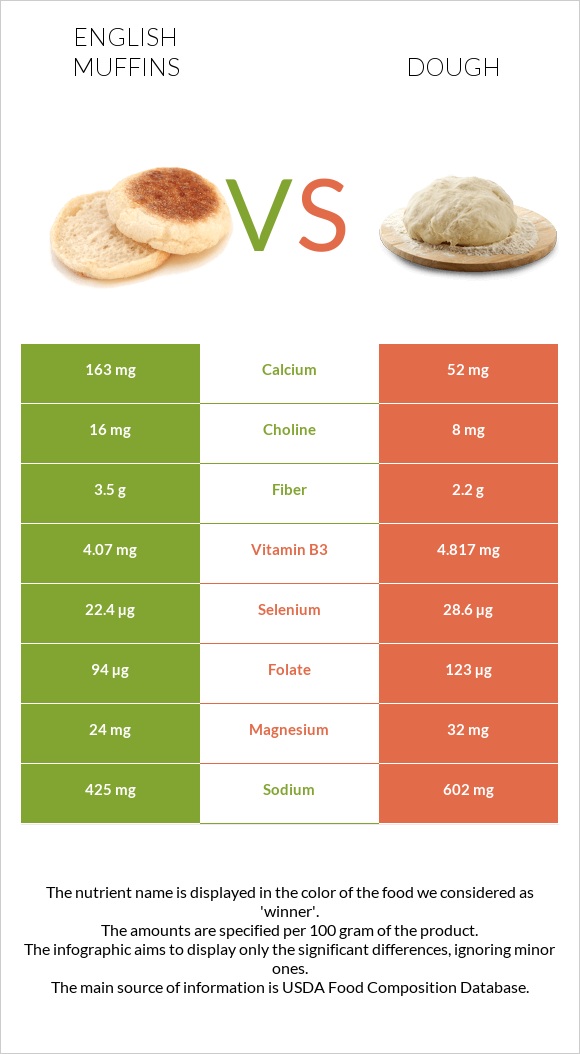
What are the differences between english muffins, plain, enriched, with ca prop (includes sourdough) and dough?
- English muffins, plain, enriched, with ca prop (includes sourdough) are higher in calcium and fiber; however, dough is richer in vitamin B1, vitamin B2, selenium, and folate.
- Dough's daily need coverage for vitamin B1 is 19% more.
- Dough contains 3 times less calcium than english muffins, plain, enriched, with ca prop (includes sourdough). English muffins, plain, enriched, with ca prop (includes sourdough) contain 163mg of calcium, while dough contains 52mg.
- English muffins, plain, enriched, with ca prop (includes sourdough) have less sodium.
- English muffins, plain, enriched, with ca prop (includes sourdough) have a lower glycemic index (45) than dough (70).
We used English muffins, plain, enriched, with ca prop (includes sourdough) and Bread, french or vienna (includes sourdough) types in this article.
Infographic
Infographic link
Mineral Comparison
Mineral comparison score is based on the number of minerals by which one or the other food is richer. The "coverage" charts below show how much of the daily needs can be covered by 300 grams of the food.
| Contains more CalciumCalcium | +213.5% |
| Contains less SodiumSodium | -29.4% |
| Contains more MagnesiumMagnesium | +33.3% |
| Contains more CopperCopper | +12.6% |
| Contains more PhosphorusPhosphorus | +14.1% |
| Contains more ManganeseManganese | +14.3% |
| Contains more SeleniumSelenium | +27.7% |
Vitamin Comparison
Vitamin comparison score is based on the number of vitamins by which one or the other food is richer. The "coverage" charts below show how much of the daily needs can be covered by 300 grams of the food.
| Contains more Vitamin CVitamin C | +∞% |
| Contains more Vitamin EVitamin E | +47.6% |
| Contains more Vitamin B12Vitamin B12 | +∞% |
| Contains more Vitamin KVitamin K | +71.4% |
| Contains more CholineCholine | +100% |
| Contains more Vitamin B1Vitamin B1 | +48.8% |
| Contains more Vitamin B2Vitamin B2 | +70.8% |
| Contains more Vitamin B3Vitamin B3 | +18.4% |
| Contains more Vitamin B5Vitamin B5 | +25.3% |
| Contains more Vitamin B6Vitamin B6 | +98.1% |
| Contains more FolateFolate | +30.9% |
All nutrients comparison - raw data values
| Nutrient |  |
 |
DV% diff. |
| Vitamin B1 | 0.477mg | 0.71mg | 19% |
| Methionine | 153mg | 15% | |
| Vitamin B2 | 0.25mg | 0.427mg | 14% |
| Selenium | 22.4µg | 28.6µg | 11% |
| Calcium | 163mg | 52mg | 11% |
| Sodium | 425mg | 602mg | 8% |
| Folate | 94µg | 123µg | 7% |
| Vitamin B3 | 4.07mg | 4.817mg | 5% |
| Fiber | 3.5g | 2.2g | 5% |
| Vitamin B6 | 0.054mg | 0.107mg | 4% |
| Protein | 8.87g | 10.75g | 4% |
| Manganese | 0.505mg | 0.577mg | 3% |
| Carbs | 44.17g | 51.88g | 3% |
| Starch | 37.2g | 44.23g | 3% |
| Vitamin B12 | 0.04µg | 0µg | 2% |
| Polyunsaturated fat | 0.498g | 0.855g | 2% |
| Calories | 227kcal | 272kcal | 2% |
| Vitamin B5 | 0.363mg | 0.455mg | 2% |
| Vitamin C | 1.8mg | 0mg | 2% |
| Magnesium | 24mg | 32mg | 2% |
| Copper | 0.135mg | 0.152mg | 2% |
| Phosphorus | 92mg | 105mg | 2% |
| Fats | 1.69g | 2.42g | 1% |
| Saturated fat | 0.733g | 0.529g | 1% |
| Choline | 16mg | 8mg | 1% |
| Vitamin E | 0.31mg | 0.21mg | 1% |
| Iron | 4mg | 3.91mg | 1% |
| Net carbs | 40.67g | 49.68g | N/A |
| Potassium | 109mg | 117mg | 0% |
| Sugar | 3.53g | 4.62g | N/A |
| Zinc | 1.05mg | 1.04mg | 0% |
| Vitamin K | 1.2µg | 0.7µg | 0% |
| Trans fat | 0g | 0.005g | N/A |
| Monounsaturated fat | 0.383g | 0.362g | 0% |
| Tryptophan | 0.108mg | 0% | |
| Threonine | 0.331mg | 0% | |
| Isoleucine | 0.404mg | 0% | |
| Leucine | 0.652mg | 0% | |
| Lysine | 0.45mg | 0% | |
| Phenylalanine | 0.417mg | 0% | |
| Valine | 0.454mg | 0% | |
| Histidine | 0.201mg | 0% | |
| Fructose | 0.69g | 0.51g | 0% |
| Omega-3 - ALA | 0.048g | 0.063g | N/A |
| Omega-6 - Gamma-linoleic acid | 0g | 0.001g | N/A |
| Omega-6 - Linoleic acid | 0.788g | N/A |
Macronutrient Comparison
Macronutrient breakdown side-by-side comparison
Protein:
8.87 g
Fats:
1.69 g
Carbs:
44.17 g
Water:
43.56 g
Other:
1.71 g
Protein:
10.75 g
Fats:
2.42 g
Carbs:
51.88 g
Water:
33 g
Other:
1.95 g
| Contains more WaterWater | +32% |
| Contains more ProteinProtein | +21.2% |
| Contains more FatsFats | +43.2% |
| Contains more CarbsCarbs | +17.5% |
| Contains more OtherOther | +14% |
Fat Type Comparison
Fat type breakdown side-by-side comparison
Saturated fat:
Sat. Fat
0.733 g
Monounsaturated fat:
Mono. Fat
0.383 g
Polyunsaturated fat:
Poly. Fat
0.498 g
Saturated fat:
Sat. Fat
0.529 g
Monounsaturated fat:
Mono. Fat
0.362 g
Polyunsaturated fat:
Poly. Fat
0.855 g
| Contains less Sat. FatSaturated fat | -27.8% |
| Contains more Poly. FatPolyunsaturated fat | +71.7% |
~equal in
Monounsaturated fat
~0.362g
Carbohydrate type comparison
Carbohydrate type breakdown side-by-side comparison
Starch:
37.2 g
Sucrose:
0 g
Glucose:
0.66 g
Fructose:
0.69 g
Lactose:
0 g
Maltose:
2.18 g
Galactose:
0 g
Starch:
44.23 g
Sucrose:
0 g
Glucose:
0.4 g
Fructose:
0.51 g
Lactose:
0 g
Maltose:
3.7 g
Galactose:
0 g
| Contains more GlucoseGlucose | +65% |
| Contains more FructoseFructose | +35.3% |
| Contains more StarchStarch | +18.9% |
| Contains more MaltoseMaltose | +69.7% |
~equal in
Sucrose
~0g
~equal in
Lactose
~0g
~equal in
Galactose
~0g