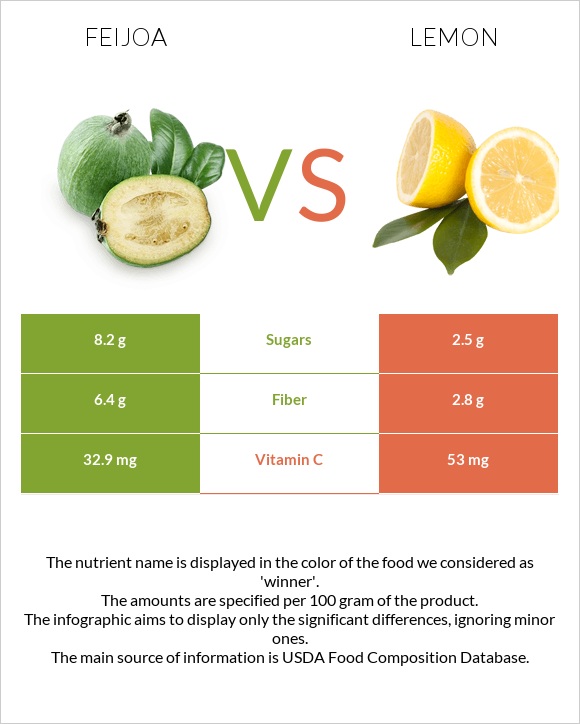
The main differences between feijoa and lemons Feijoa has more fiber; however, lemons have more vitamin C and iron. Daily need coverage for vitamin C for lemons is 22% higher. Lemons have 3 times less sugar than feijoa. Feijoa has 8.2g of sugar, while lemons have 2.5g. Food types used in this article are Feijoa, raw and Lemons, raw, without peel .
Infographic
Mineral Comparison
Mineral comparison score is based on the number of minerals by which one or the other food is richer. The "coverage" charts below show how much of the daily needs can be covered by 300 grams of the food.
4
100 g
300 g
1 fruit without peel - 42g 1 cup 1/2" chunks - 205g 1 cup, pureed - 243g
Magnesium
Magnesium
Calcium
Calcium
Potassium
Potassium
Iron
Iron
Copper
Copper
Zinc
Zinc
Phosphorus
Phosphorus
Sodium
Sodium
Manganese
Manganese
Selenium
Selenium
6.4%
5.1%
15%
5.3%
12%
1.6%
8.1%
0.39%
11%
0%
4
100 g
300 g
1 wedge or slice (1/8 of one 2-1/8" dia lemon) - 7g 1 fruit (2-1/8" dia) - 58g 1 NLEA serving - 58g 1 fruit (2-3/8" dia) - 84g 1 cup, sections - 212g
Magnesium
Magnesium
Calcium
Calcium
Potassium
Potassium
Iron
Iron
Copper
Copper
Zinc
Zinc
Phosphorus
Phosphorus
Sodium
Sodium
Manganese
Manganese
Selenium
Selenium
5.7%
7.8%
12%
23%
12%
1.6%
6.9%
0.26%
3.9%
2.2%
Vitamin Comparison
Vitamin comparison score is based on the number of vitamins by which one or the other food is richer. The "coverage" charts below show how much of the daily needs can be covered by 300 grams of the food.
4
100 g
300 g
1 fruit without peel - 42g 1 cup 1/2" chunks - 205g 1 cup, pureed - 243g
Vitamin C
Vit. C
Vitamin D
Vit. D
Vitamin A
Vit. A
Vitamin E
Vit. E
Vitamin B1
Vit. B1
Vitamin B2
Vit. B2
Vitamin B3
Vit. B3
Vitamin B5
Vit. B5
Vitamin B6
Vit. B6
Vitamin B12
Vit. B12
Vitamin K
Vit. K
Folate
Folate
110%
0%
0%
3.2%
1.5%
4.2%
5.5%
14%
15%
0%
8.8%
17%
5
100 g
300 g
1 wedge or slice (1/8 of one 2-1/8" dia lemon) - 7g 1 fruit (2-1/8" dia) - 58g 1 NLEA serving - 58g 1 fruit (2-3/8" dia) - 84g 1 cup, sections - 212g
Vitamin C
Vit. C
Vitamin D
Vit. D
Vitamin A
Vit. A
Vitamin E
Vit. E
Vitamin B1
Vit. B1
Vitamin B2
Vit. B2
Vitamin B3
Vit. B3
Vitamin B5
Vit. B5
Vitamin B6
Vit. B6
Vitamin B12
Vit. B12
Vitamin K
Vit. K
Folate
Folate
177%
0%
0.33%
3%
10%
4.6%
1.9%
11%
18%
0%
0%
8.3%
All nutrients comparison - raw data values
Nutrient
DV% diff.
Vitamin C
32.9mg
53mg
22%
Fiber
6.4g
2.8g
14%
Iron
0.14mg
0.6mg
6%
Fructose
2.95g
4%
Vitamin B1
0.006mg
0.04mg
3%
Vitamin K
3.5µg
0µg
3%
Folate
23µg
11µg
3%
Calories
61kcal
29kcal
2%
Carbs
15.21g
9.32g
2%
Manganese
0.084mg
0.03mg
2%
Protein
0.71g
1.1g
1%
Calcium
17mg
26mg
1%
Potassium
172mg
138mg
1%
Selenium
0.4µg
1%
Vitamin B3
0.295mg
0.1mg
1%
Vitamin B5
0.233mg
0.19mg
1%
Vitamin B6
0.067mg
0.08mg
1%
Choline
5.1mg
1%
Protein per 100 calories
1.2g
3.8g
N/A
Calories per 10 g protein
859kcal
264kcal
N/A
Weight per 100 calories
164g
345g
N/A
Fats
0.42g
0.3g
0%
Net carbs
8.81g
6.52g
N/A
Magnesium
9mg
8mg
0%
Sugar
8.2g
2.5g
N/A
Copper
0.036mg
0.037mg
0%
Zinc
0.06mg
0.06mg
0%
Phosphorus
19mg
16mg
0%
Sodium
3mg
2mg
0%
Vitamin A
0µg
1µg
0%
Vitamin E
0.16mg
0.15mg
0%
Vitamin B2
0.018mg
0.02mg
0%
Saturated fat
0.104g
0.039g
0%
Monounsaturated fat
0.056g
0.011g
0%
Polyunsaturated fat
0.136g
0.089g
0%
Tryptophan
0.007mg
0%
Threonine
0.019mg
0%
Isoleucine
0.019mg
0%
Leucine
0.028mg
0%
Lysine
0.038mg
0%
Methionine
0.007mg
0%
Phenylalanine
0.019mg
0%
Valine
0.019mg
0%
Histidine
0.009mg
0%
Omega-3 - ALA
0.029g
N/A
Omega-6 - Linoleic acid
0.107g
N/A
Macronutrient Comparison
Macronutrient breakdown side-by-side comparison
3
15%
83%
Protein:
0.71 g
Fats:
0.42 g
Carbs:
15.21 g
Water:
83.28 g
Other:
0.38 g
2
9%
89%
Protein:
1.1 g
Fats:
0.3 g
Carbs:
9.32 g
Water:
88.98 g
Other:
0.3 g
Contains
more
Fats Fats
+40%
Contains
more
Carbs Carbs
+63.2%
Contains
more
Other Other
+26.7%
Contains
more
Protein Protein
+54.9%
Fat Type Comparison
Fat type breakdown side-by-side comparison
2
35%
19%
46%
Saturated fat:
Sat. Fat
0.104 g
Monounsaturated fat:
Mono. Fat
0.056 g
Polyunsaturated fat:
Poly. Fat
0.136 g
1
28%
8%
64%
Saturated fat:
Sat. Fat
0.039 g
Monounsaturated fat:
Mono. Fat
0.011 g
Polyunsaturated fat:
Poly. Fat
0.089 g
Contains
more
Mono. Fat Monounsaturated fat
+409.1%
Contains
more
Poly. Fat Polyunsaturated fat
+52.8%
Contains
less
Sat. Fat Saturated fat
-62.5%