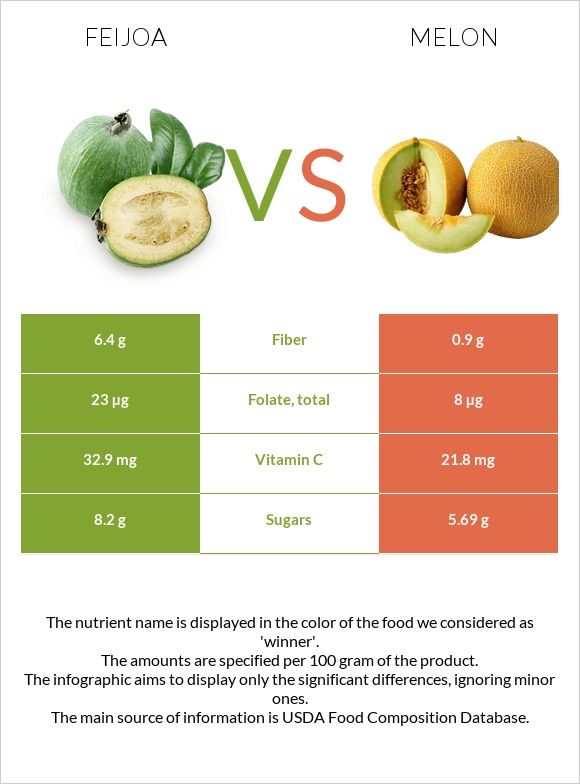
What are the differences between feijoa and melon? Feijoa is higher in fiber and vitamin C, yet melon is higher in vitamin B6. Feijoa's daily need coverage for fiber is 22% more. Feijoa has 3 times more folate than melon. While feijoa has 23µg of folate, melon has only 8µg. The amount of sugar in melon is lower. The glycemic index of feijoa is lower. We used Feijoa, raw and Melons, casaba, raw types in this article.
Infographic
Mineral Comparison
Mineral comparison score is based on the number of minerals by which one or the other food is richer. The "coverage" charts below show how much of the daily needs can be covered by 300 grams of the food.
4
100 g
300 g
1 fruit without peel - 42g 1 cup 1/2" chunks - 205g 1 cup, pureed - 243g
Magnesium
Magnesium
Calcium
Calcium
Potassium
Potassium
Iron
Iron
Copper
Copper
Zinc
Zinc
Phosphorus
Phosphorus
Sodium
Sodium
Manganese
Manganese
Selenium
Selenium
6.4%
5.1%
15%
5.3%
12%
1.6%
8.1%
0.39%
11%
0%
5
100 g
300 g
0.1 fruit - 164g 1 cup, cubes - 170g 1 melon - 1640g
Magnesium
Magnesium
Calcium
Calcium
Potassium
Potassium
Iron
Iron
Copper
Copper
Zinc
Zinc
Phosphorus
Phosphorus
Sodium
Sodium
Manganese
Manganese
Selenium
Selenium
7.9%
3.3%
16%
13%
20%
1.9%
2.1%
1.2%
4.6%
2.2%
Vitamin Comparison
Vitamin comparison score is based on the number of vitamins by which one or the other food is richer. The "coverage" charts below show how much of the daily needs can be covered by 300 grams of the food.
6
100 g
300 g
1 fruit without peel - 42g 1 cup 1/2" chunks - 205g 1 cup, pureed - 243g
Vitamin C
Vit. C
Vitamin D
Vit. D
Vitamin A
Vit. A
Vitamin E
Vit. E
Vitamin B1
Vit. B1
Vitamin B2
Vit. B2
Vitamin B3
Vit. B3
Vitamin B5
Vit. B5
Vitamin B6
Vit. B6
Vitamin B12
Vit. B12
Vitamin K
Vit. K
Folate
Folate
110%
0%
0%
3.2%
1.5%
4.2%
5.5%
14%
15%
0%
8.8%
17%
3
100 g
300 g
0.1 fruit - 164g 1 cup, cubes - 170g 1 melon - 1640g
Vitamin C
Vit. C
Vitamin D
Vit. D
Vitamin A
Vit. A
Vitamin E
Vit. E
Vitamin B1
Vit. B1
Vitamin B2
Vit. B2
Vitamin B3
Vit. B3
Vitamin B5
Vit. B5
Vitamin B6
Vit. B6
Vitamin B12
Vit. B12
Vitamin K
Vit. K
Folate
Folate
73%
0%
0%
1%
3.8%
7.2%
4.4%
5%
38%
0%
6.3%
6%
All nutrients comparison - raw data values
Nutrient
DV% diff.
Fiber
6.4g
0.9g
22%
Vitamin C
32.9mg
21.8mg
12%
Vitamin B6
0.067mg
0.163mg
7%
Folate
23µg
8µg
4%
Fructose
2.95g
4%
Carbs
15.21g
6.58g
3%
Iron
0.14mg
0.34mg
3%
Copper
0.036mg
0.06mg
3%
Vitamin B5
0.233mg
0.084mg
3%
Calories
61kcal
28kcal
2%
Phosphorus
19mg
5mg
2%
Manganese
0.084mg
0.035mg
2%
Protein
0.71g
1.11g
1%
Calcium
17mg
11mg
1%
Vitamin E
0.16mg
0.05mg
1%
Selenium
0.4µg
1%
Vitamin B1
0.006mg
0.015mg
1%
Vitamin B2
0.018mg
0.031mg
1%
Vitamin K
3.5µg
2.5µg
1%
Choline
7.6mg
1%
Polyunsaturated fat
0.136g
0.039g
1%
Protein per 100 calories
1.2g
4g
N/A
Calories per 10 g protein
859kcal
252kcal
N/A
Weight per 100 calories
164g
357g
N/A
Fats
0.42g
0.1g
0%
Net carbs
8.81g
5.68g
N/A
Magnesium
9mg
11mg
0%
Potassium
172mg
182mg
0%
Sugar
8.2g
5.69g
N/A
Zinc
0.06mg
0.07mg
0%
Sodium
3mg
9mg
0%
Vitamin B3
0.295mg
0.232mg
0%
Saturated fat
0.104g
0.025g
0%
Monounsaturated fat
0.056g
0.002g
0%
Tryptophan
0.007mg
0%
Threonine
0.019mg
0%
Isoleucine
0.019mg
0%
Leucine
0.028mg
0%
Lysine
0.038mg
0%
Methionine
0.007mg
0%
Phenylalanine
0.019mg
0%
Valine
0.019mg
0%
Histidine
0.009mg
0%
Omega-3 - ALA
0.029g
N/A
Omega-6 - Linoleic acid
0.107g
N/A
Macronutrient Comparison
Macronutrient breakdown side-by-side comparison
3
15%
83%
Protein:
0.71 g
Fats:
0.42 g
Carbs:
15.21 g
Water:
83.28 g
Other:
0.38 g
2
7%
92%
Protein:
1.11 g
Fats:
0.1 g
Carbs:
6.58 g
Water:
91.85 g
Other:
0.36 g
Contains
more
Fats Fats
+320%
Contains
more
Carbs Carbs
+131.2%
Contains
more
Protein Protein
+56.3%
Contains
more
Water Water
+10.3%
Fat Type Comparison
Fat type breakdown side-by-side comparison
2
35%
19%
46%
Saturated fat:
Sat. Fat
0.104 g
Monounsaturated fat:
Mono. Fat
0.056 g
Polyunsaturated fat:
Poly. Fat
0.136 g
1
38%
3%
59%
Saturated fat:
Sat. Fat
0.025 g
Monounsaturated fat:
Mono. Fat
0.002 g
Polyunsaturated fat:
Poly. Fat
0.039 g
Contains
more
Mono. Fat Monounsaturated fat
+2700%
Contains
more
Poly. Fat Polyunsaturated fat
+248.7%
Contains
less
Sat. Fat Saturated fat
-76%