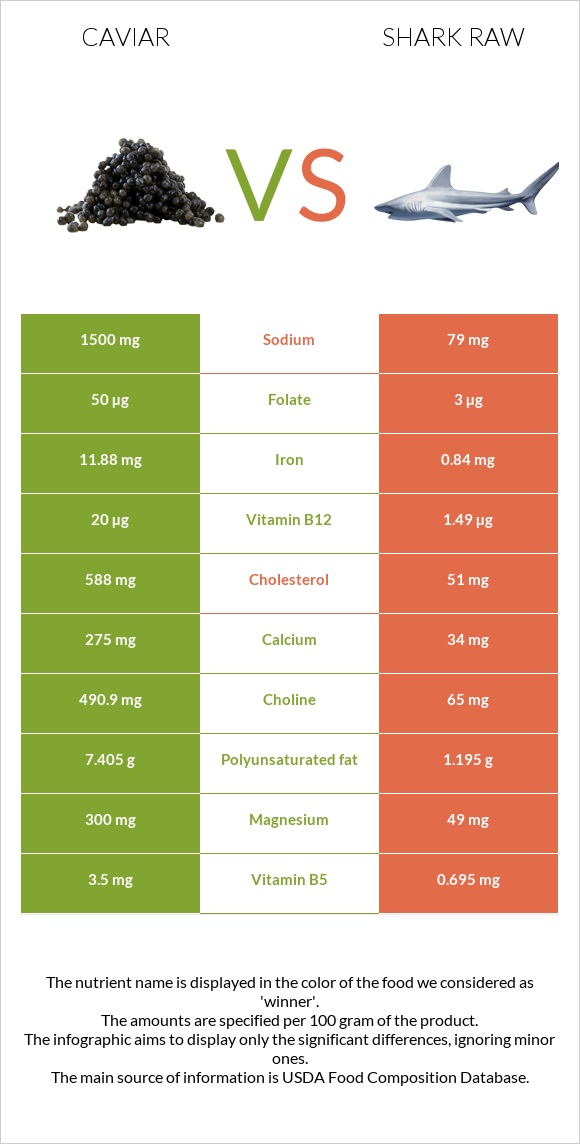
What are the differences between caviar and shark raw? Caviar is richer than shark raw in vitamin B12, iron, choline, magnesium, vitamin B5, selenium, vitamin B2, and calcium. Caviar's daily need coverage for vitamin B12 is 771% more. Caviar has 19 times more sodium than shark raw. While caviar has 1500mg of sodium, shark raw has only 79mg. We used Fish, caviar, black, and red, granular and Fish, shark, mixed species, raw types in this article.
Infographic
Mineral Comparison
Mineral comparison score is based on the number of minerals by which one or the other food is richer. The "coverage" charts below show how much of the daily needs can be covered by 300 grams of the food.
9
100 g
300 g
1 tbsp - 16g 1 oz - 28.35g
Magnesium
Magnesium
Calcium
Calcium
Potassium
Potassium
Iron
Iron
Copper
Copper
Zinc
Zinc
Phosphorus
Phosphorus
Sodium
Sodium
Manganese
Manganese
Selenium
Selenium
214%
83%
16%
446%
37%
26%
153%
196%
6.5%
357%
1
100 g
300 g
3 oz - 85g
Magnesium
Magnesium
Calcium
Calcium
Potassium
Potassium
Iron
Iron
Copper
Copper
Zinc
Zinc
Phosphorus
Phosphorus
Sodium
Sodium
Manganese
Manganese
Selenium
Selenium
35%
10%
14%
32%
11%
12%
90%
10%
2%
199%
Vitamin Comparison
Vitamin comparison score is based on the number of vitamins by which one or the other food is richer. The "coverage" charts below show how much of the daily needs can be covered by 300 grams of the food.
9
100 g
300 g
1 tbsp - 16g 1 oz - 28.35g
Vitamin C
Vit. C
Vitamin D
Vit. D
Vitamin A
Vit. A
Vitamin E
Vit. E
Vitamin B1
Vit. B1
Vitamin B2
Vit. B2
Vitamin B3
Vit. B3
Vitamin B5
Vit. B5
Vitamin B6
Vit. B6
Vitamin B12
Vit. B12
Vitamin K
Vit. K
Folate
Folate
0%
44%
90%
38%
48%
143%
2.3%
210%
74%
2500%
1.5%
38%
2
100 g
300 g
3 oz - 85g
Vitamin C
Vit. C
Vitamin D
Vit. D
Vitamin A
Vit. A
Vitamin E
Vit. E
Vitamin B1
Vit. B1
Vitamin B2
Vit. B2
Vitamin B3
Vit. B3
Vitamin B5
Vit. B5
Vitamin B6
Vit. B6
Vitamin B12
Vit. B12
Vitamin K
Vit. K
Folate
Folate
0%
9%
23%
20%
11%
14%
55%
42%
92%
186%
0.25%
2.3%
All nutrients comparison - raw data values
Nutrient
DV% diff.
Vitamin B12
20µg
1.49µg
771%
Cholesterol
588mg
51mg
179%
Iron
11.88mg
0.84mg
138%
Choline
490.9mg
65mg
77%
Sodium
1500mg
79mg
62%
Magnesium
300mg
49mg
60%
Vitamin B5
3.5mg
0.695mg
56%
Selenium
65.5µg
36.5µg
53%
Vitamin B2
0.62mg
0.062mg
43%
Polyunsaturated fat
7.405g
1.195g
41%
Calcium
275mg
34mg
24%
Vitamin A
271µg
70µg
22%
Fats
17.9g
4.51g
21%
Phosphorus
356mg
210mg
21%
Vitamin B3
0.12mg
2.938mg
18%
Saturated fat
4.06g
0.925g
14%
Vitamin D*
117 IU
24 IU
12%
Vitamin D
2.9µg
0.6µg
12%
Vitamin B1
0.19mg
0.042mg
12%
Folate
50µg
3µg
12%
Copper
0.11mg
0.033mg
9%
Calories
264kcal
130kcal
7%
Protein
24.6g
20.98g
7%
Monounsaturated fat
4.631g
1.808g
7%
Vitamin E
1.89mg
1mg
6%
Vitamin B6
0.32mg
0.4mg
6%
Zinc
0.95mg
0.43mg
5%
Manganese
0.05mg
0.015mg
2%
Carbs
4g
0g
1%
Potassium
181mg
160mg
1%
Protein per 100 calories
9.3g
16g
N/A
Calories per 10 g protein
107kcal
62kcal
N/A
Weight per 100 calories
38g
77g
N/A
Unsaturated / Saturated Fat ratio
3
3.2
N/A
Net carbs
4g
0g
N/A
Vitamin K
0.6µg
0.1µg
0%
Tryptophan
0.323mg
0.235mg
0%
Threonine
1.263mg
0.92mg
0%
Isoleucine
1.035mg
0.967mg
0%
Leucine
2.133mg
1.705mg
0%
Lysine
1.834mg
1.926mg
0%
Methionine
0.646mg
0.621mg
0%
Phenylalanine
1.071mg
0.819mg
0%
Valine
1.263mg
1.081mg
0%
Histidine
0.649mg
0.618mg
0%
Omega-3 - EPA
2.741g
0.316g
N/A
Omega-3 - DHA
3.8g
0.527g
N/A
Omega-3 - DPA
0.229g
0.109g
N/A
Macronutrient Comparison
Macronutrient breakdown side-by-side comparison
4
25%
18%
4%
48%
6%
Protein:
24.6 g
Fats:
17.9 g
Carbs:
4 g
Water:
47.5 g
Other:
6 g
1
21%
5%
74%
Protein:
20.98 g
Fats:
4.51 g
Carbs:
0 g
Water:
73.58 g
Other:
0.93 g
Contains
more
Protein Protein
+17.3%
Contains
more
Fats Fats
+296.9%
Contains
more
Carbs Carbs
+∞%
Contains
more
Other Other
+545.2%
Contains
more
Water Water
+54.9%
Fat Type Comparison
Fat type breakdown side-by-side comparison
2
25%
29%
46%
Saturated fat:
Sat. Fat
4.06 g
Monounsaturated fat:
Mono. Fat
4.631 g
Polyunsaturated fat:
Poly. Fat
7.405 g
1
24%
46%
30%
Saturated fat:
Sat. Fat
0.925 g
Monounsaturated fat:
Mono. Fat
1.808 g
Polyunsaturated fat:
Poly. Fat
1.195 g
Contains
more
Mono. Fat Monounsaturated fat
+156.1%
Contains
more
Poly. Fat Polyunsaturated fat
+519.7%
Contains
less
Sat. Fat Saturated fat
-77.2%