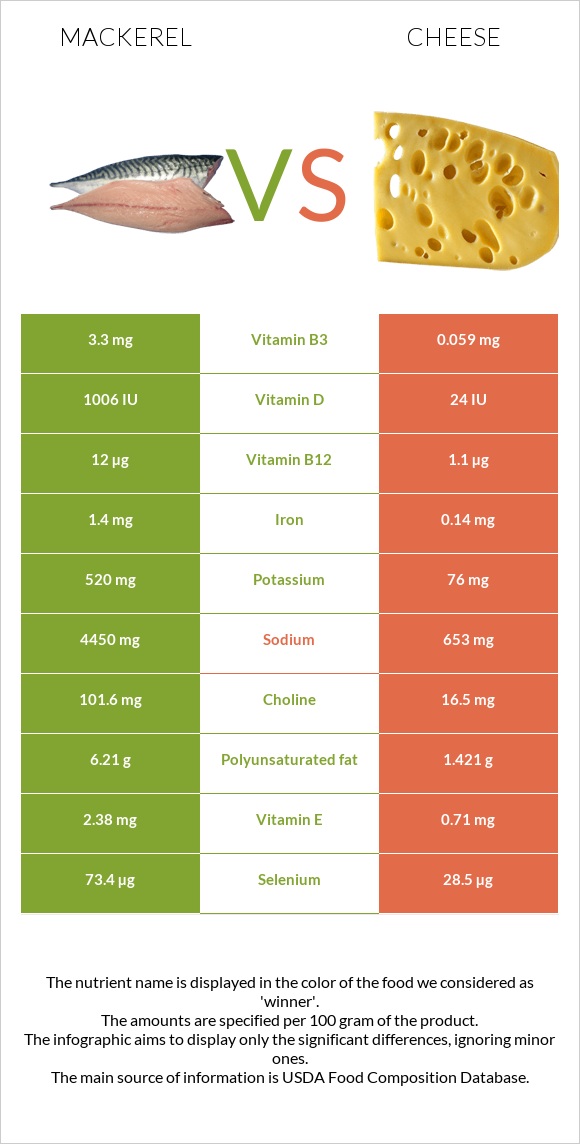
How are mackerel and cheese different? Mackerel is higher in vitamin B12, vitamin D*, selenium, and vitamin B6; however, cheese is richer in calcium, phosphorus, zinc, and vitamin A. Daily need coverage for vitamin B12 for mackerel is 454% higher. Mackerel contains 42 times more vitamin D* than cheese. While mackerel contains 1006 IU of vitamin D*, cheese contains only 24 IU. Cheese has less sodium. Fish, mackerel, salted and Cheese, cheddar are the varieties used in this article.
Infographic
Mineral Comparison
Mineral comparison score is based on the number of minerals by which one or the other food is richer. The "coverage" charts below show how much of the daily needs can be covered by 300 grams of the food.
5
100 g
300 g
1 cubic inch, boneless - 17g 1 piece (5-1/2" x 1-1/2" x 1/2") - 80g 1 cup, cooked - 136g
Magnesium
Magnesium
Calcium
Calcium
Potassium
Potassium
Iron
Iron
Copper
Copper
Zinc
Zinc
Phosphorus
Phosphorus
Sodium
Sodium
Manganese
Manganese
Selenium
Selenium
43%
20%
46%
53%
33%
30%
109%
580%
0%
400%
5
100 g
300 g
1 cubic inch - 17g 1 slice (1 oz) - 28g 1 oz - 28.35g 1 cup, shredded - 113g 1 cup, diced - 132g 1 cup, melted - 244g
Magnesium
Magnesium
Calcium
Calcium
Potassium
Potassium
Iron
Iron
Copper
Copper
Zinc
Zinc
Phosphorus
Phosphorus
Sodium
Sodium
Manganese
Manganese
Selenium
Selenium
19%
213%
6.7%
5.3%
10%
99%
195%
85%
3.5%
155%
Vitamin Comparison
Vitamin comparison score is based on the number of vitamins by which one or the other food is richer. The "coverage" charts below show how much of the daily needs can be covered by 300 grams of the food.
6
100 g
300 g
1 cubic inch, boneless - 17g 1 piece (5-1/2" x 1-1/2" x 1/2") - 80g 1 cup, cooked - 136g
Vitamin C
Vit. C
Vitamin D
Vit. D
Vitamin A
Vit. A
Vitamin E
Vit. E
Vitamin B1
Vit. B1
Vitamin B2
Vit. B2
Vitamin B3
Vit. B3
Vitamin B5
Vit. B5
Vitamin B6
Vit. B6
Vitamin B12
Vit. B12
Vitamin K
Vit. K
Folate
Folate
0%
378%
16%
48%
5%
44%
62%
0%
95%
1500%
20%
11%
5
100 g
300 g
1 cubic inch - 17g 1 slice (1 oz) - 28g 1 oz - 28.35g 1 cup, shredded - 113g 1 cup, diced - 132g 1 cup, melted - 244g
Vitamin C
Vit. C
Vitamin D
Vit. D
Vitamin A
Vit. A
Vitamin E
Vit. E
Vitamin B1
Vit. B1
Vitamin B2
Vit. B2
Vitamin B3
Vit. B3
Vitamin B5
Vit. B5
Vitamin B6
Vit. B6
Vitamin B12
Vit. B12
Vitamin K
Vit. K
Folate
Folate
0%
9%
110%
14%
7.3%
99%
1.1%
25%
15%
138%
6%
20%
All nutrients comparison - raw data values
Nutrient
DV% diff.
Vitamin B12
12µg
1.1µg
454%
Sodium
4450mg
653mg
165%
Vitamin D*
1006 IU
24 IU
123%
Vitamin D
25.2µg
0.6µg
123%
Selenium
73.4µg
28.5µg
82%
Calcium
66mg
710mg
64%
Saturated fat
7.148g
18.867g
53%
Polyunsaturated fat
6.21g
1.421g
32%
Vitamin A
47µg
330µg
31%
Phosphorus
254mg
455mg
29%
Vitamin B6
0.41mg
0.066mg
26%
Zinc
1.1mg
3.64mg
23%
Vitamin B3
3.3mg
0.059mg
20%
Vitamin B2
0.19mg
0.428mg
18%
Iron
1.4mg
0.14mg
16%
Choline
101.6mg
16.5mg
15%
Fats
25.1g
33.31g
13%
Potassium
520mg
76mg
13%
Vitamin E
2.38mg
0.71mg
11%
Protein
18.5g
22.87g
9%
Magnesium
60mg
27mg
8%
Copper
0.1mg
0.03mg
8%
Vitamin B5
0.41mg
8%
Calories
305kcal
404kcal
5%
Vitamin K
7.8µg
2.4µg
5%
Folate
15µg
27µg
3%
Monounsaturated fat
8.32g
9.246g
2%
Carbs
0g
3.09g
1%
Cholesterol
95mg
99mg
1%
Manganese
0.027mg
1%
Vitamin B1
0.02mg
0.029mg
1%
Protein per 100 calories
6.1g
5.7g
N/A
Calories per 10 g protein
165kcal
177kcal
N/A
Weight per 100 calories
33g
25g
N/A
Unsaturated / Saturated Fat ratio
2
0.57
N/A
Net carbs
0g
3.09g
N/A
Sugar
0g
0.48g
N/A
Trans fat
0.917g
N/A
Tryptophan
0.547mg
0%
Threonine
1.044mg
0%
Isoleucine
1.206mg
0%
Leucine
1.939mg
0%
Lysine
1.025mg
0%
Methionine
0.547mg
0%
Phenylalanine
1.074mg
0%
Valine
1.404mg
0%
Histidine
0.547mg
0%
Omega-3 - EPA
1.619g
0.01g
N/A
Omega-3 - DHA
2.965g
0.001g
N/A
Omega-3 - DPA
0.391g
0.017g
N/A
Omega-6 - Eicosadienoic acid
0.007g
N/A
Macronutrient Comparison
Macronutrient breakdown side-by-side comparison
2
19%
25%
43%
13%
Protein:
18.5 g
Fats:
25.1 g
Carbs:
0 g
Water:
43 g
Other:
13.4 g
3
23%
33%
3%
37%
4%
Protein:
22.87 g
Fats:
33.31 g
Carbs:
3.09 g
Water:
37.02 g
Other:
3.71 g
Contains
more
Water Water
+16.2%
Contains
more
Other Other
+261.2%
Contains
more
Protein Protein
+23.6%
Contains
more
Fats Fats
+32.7%
Contains
more
Carbs Carbs
+∞%
Fat Type Comparison
Fat type breakdown side-by-side comparison
2
33%
38%
29%
Saturated fat:
Sat. Fat
7.148 g
Monounsaturated fat:
Mono. Fat
8.32 g
Polyunsaturated fat:
Poly. Fat
6.21 g
1
64%
31%
5%
Saturated fat:
Sat. Fat
18.867 g
Monounsaturated fat:
Mono. Fat
9.246 g
Polyunsaturated fat:
Poly. Fat
1.421 g
Contains
less
Sat. Fat Saturated fat
-62.1%
Contains
more
Poly. Fat Polyunsaturated fat
+337%
Contains
more
Mono. Fat Monounsaturated fat
+11.1%