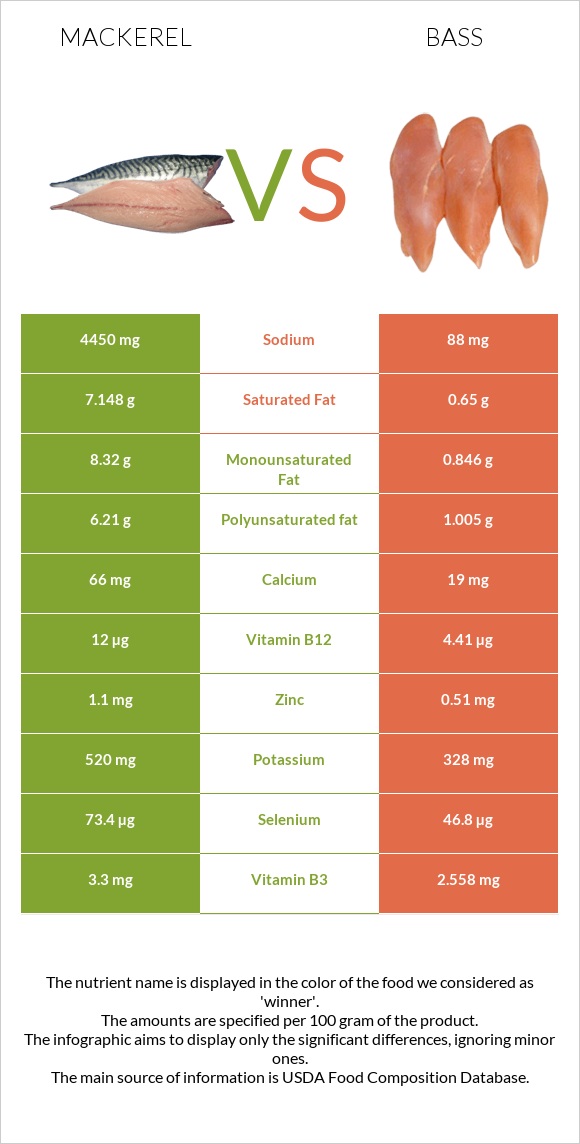
How are mackerel and sea bass different? Mackerel is richer in vitamin B12, selenium, vitamin B2, copper, potassium, and zinc, while sea bass is higher in vitamin B1. Mackerel covers your daily need for vitamin B12, 316% more than sea bass. Mackerel contains 51 times more sodium than sea bass. Mackerel contains 4450mg of sodium, while sea bass contains 88mg. Fish, mackerel, salted and Fish, bass, striped, cooked, dry heat types were used in this article.
Infographic
Mineral Comparison
Mineral comparison score is based on the number of minerals by which one or the other food is richer. The "coverage" charts below show how much of the daily needs can be covered by 300 grams of the food.
7
100 g
300 g
1 cubic inch, boneless - 17g 1 piece (5-1/2" x 1-1/2" x 1/2") - 80g 1 cup, cooked - 136g
Magnesium
Magnesium
Calcium
Calcium
Potassium
Potassium
Iron
Iron
Copper
Copper
Zinc
Zinc
Phosphorus
Phosphorus
Sodium
Sodium
Manganese
Manganese
Selenium
Selenium
43%
20%
46%
53%
33%
30%
109%
580%
0%
400%
2
100 g
300 g
3 oz - 85g 1 fillet - 124g
Magnesium
Magnesium
Calcium
Calcium
Potassium
Potassium
Iron
Iron
Copper
Copper
Zinc
Zinc
Phosphorus
Phosphorus
Sodium
Sodium
Manganese
Manganese
Selenium
Selenium
36%
5.7%
29%
41%
13%
14%
109%
11%
2.5%
255%
Vitamin Comparison
Vitamin comparison score is based on the number of vitamins by which one or the other food is richer. The "coverage" charts below show how much of the daily needs can be covered by 300 grams of the food.
9
100 g
300 g
1 cubic inch, boneless - 17g 1 piece (5-1/2" x 1-1/2" x 1/2") - 80g 1 cup, cooked - 136g
Vitamin C
Vit. C
Vitamin D
Vit. D
Vitamin A
Vit. A
Vitamin E
Vit. E
Vitamin B1
Vit. B1
Vitamin B2
Vit. B2
Vitamin B3
Vit. B3
Vitamin B5
Vit. B5
Vitamin B6
Vit. B6
Vitamin B12
Vit. B12
Vitamin K
Vit. K
Folate
Folate
0%
378%
16%
48%
5%
44%
62%
0%
95%
1500%
20%
11%
2
100 g
300 g
3 oz - 85g 1 fillet - 124g
Vitamin C
Vit. C
Vitamin D
Vit. D
Vitamin A
Vit. A
Vitamin E
Vit. E
Vitamin B1
Vit. B1
Vitamin B2
Vit. B2
Vitamin B3
Vit. B3
Vitamin B5
Vit. B5
Vitamin B6
Vit. B6
Vitamin B12
Vit. B12
Vitamin K
Vit. K
Folate
Folate
0%
0%
10%
0%
29%
8.5%
48%
52%
80%
551%
0%
7.5%
All nutrients comparison - raw data values
Nutrient
DV% diff.
Vitamin B12
12µg
4.41µg
316%
Sodium
4450mg
88mg
190%
Vitamin D*
1006 IU
126%
Vitamin D
25.2µg
126%
Selenium
73.4µg
46.8µg
48%
Polyunsaturated fat
6.21g
1.005g
35%
Fats
25.1g
2.99g
34%
Saturated fat
7.148g
0.65g
30%
Monounsaturated fat
8.32g
0.846g
19%
Choline
101.6mg
18%
Vitamin B5
0.865mg
17%
Vitamin E
2.38mg
16%
Vitamin B2
0.19mg
0.037mg
12%
Calories
305kcal
124kcal
9%
Protein
18.5g
22.73g
8%
Vitamin B1
0.02mg
0.115mg
8%
Copper
0.1mg
0.04mg
7%
Vitamin K
7.8µg
7%
Potassium
520mg
328mg
6%
Calcium
66mg
19mg
5%
Zinc
1.1mg
0.51mg
5%
Vitamin B3
3.3mg
2.558mg
5%
Vitamin B6
0.41mg
0.346mg
5%
Iron
1.4mg
1.08mg
4%
Cholesterol
95mg
103mg
3%
Magnesium
60mg
51mg
2%
Vitamin A
47µg
31µg
2%
Manganese
0.019mg
1%
Folate
15µg
10µg
1%
Protein per 100 calories
6.1g
18g
N/A
Calories per 10 g protein
165kcal
55kcal
N/A
Weight per 100 calories
33g
81g
N/A
Unsaturated / Saturated Fat ratio
2
2.8
N/A
Phosphorus
254mg
254mg
0%
Tryptophan
0.255mg
0%
Threonine
0.997mg
0%
Isoleucine
1.047mg
0%
Leucine
1.848mg
0%
Lysine
2.088mg
0%
Methionine
0.673mg
0%
Phenylalanine
0.887mg
0%
Valine
1.171mg
0%
Histidine
0.669mg
0%
Omega-3 - EPA
1.619g
0.217g
N/A
Omega-3 - DHA
2.965g
0.75g
N/A
Omega-3 - DPA
0.391g
N/A
Macronutrient Comparison
Macronutrient breakdown side-by-side comparison
2
19%
25%
43%
13%
Protein:
18.5 g
Fats:
25.1 g
Carbs:
0 g
Water:
43 g
Other:
13.4 g
2
23%
3%
73%
Protein:
22.73 g
Fats:
2.99 g
Carbs:
0 g
Water:
73.36 g
Other:
0.92 g
Contains
more
Fats Fats
+739.5%
Contains
more
Other Other
+1356.5%
Contains
more
Protein Protein
+22.9%
Contains
more
Water Water
+70.6%
Fat Type Comparison
Fat type breakdown side-by-side comparison
2
33%
38%
29%
Saturated fat:
Sat. Fat
7.148 g
Monounsaturated fat:
Mono. Fat
8.32 g
Polyunsaturated fat:
Poly. Fat
6.21 g
1
26%
34%
40%
Saturated fat:
Sat. Fat
0.65 g
Monounsaturated fat:
Mono. Fat
0.846 g
Polyunsaturated fat:
Poly. Fat
1.005 g
Contains
more
Mono. Fat Monounsaturated fat
+883.5%
Contains
more
Poly. Fat Polyunsaturated fat
+517.9%
Contains
less
Sat. Fat Saturated fat
-90.9%