How are mackerel and paprika different? Mackerel is richer in vitamin B12, vitamin D* and selenium, while paprika is higher in vitamin A, iron, vitamin E, fiber, vitamin B6, and vitamin B2. Paprika covers your daily need for vitamin A, 982% more than mackerel. Paprika is lower in sodium. Fish, mackerel, salted and Spices, paprika types were used in this article.
Infographic
Mineral Comparison
Mineral comparison score is based on the number of minerals by which one or the other food is richer. The "coverage" charts below show how much of the daily needs can be covered by 300 grams of the food.
1
100 g
300 g
1 cubic inch, boneless - 17g 1 piece (5-1/2" x 1-1/2" x 1/2") - 80g 1 cup, cooked - 136g
Magnesium
Magnesium
Calcium
Calcium
Potassium
Potassium
Iron
Iron
Copper
Copper
Zinc
Zinc
Phosphorus
Phosphorus
Sodium
Sodium
Manganese
Manganese
Selenium
Selenium
43%
20%
46%
53%
33%
30%
109%
580%
0%
400%
9
100 g
300 g
0.25 tsp - 0.5g 1 tbsp - 6.8g
Magnesium
Magnesium
Calcium
Calcium
Potassium
Potassium
Iron
Iron
Copper
Copper
Zinc
Zinc
Phosphorus
Phosphorus
Sodium
Sodium
Manganese
Manganese
Selenium
Selenium
127%
69%
201%
793%
238%
118%
135%
8.9%
207%
34%
Vitamin Comparison
Vitamin comparison score is based on the number of vitamins by which one or the other food is richer. The "coverage" charts below show how much of the daily needs can be covered by 300 grams of the food.
2
100 g
300 g
1 cubic inch, boneless - 17g 1 piece (5-1/2" x 1-1/2" x 1/2") - 80g 1 cup, cooked - 136g
Vitamin C
Vit. C
Vitamin D
Vit. D
Vitamin A
Vit. A
Vitamin E
Vit. E
Vitamin B1
Vit. B1
Vitamin B2
Vit. B2
Vitamin B3
Vit. B3
Vitamin B5
Vit. B5
Vitamin B6
Vit. B6
Vitamin B12
Vit. B12
Vitamin K
Vit. K
Folate
Folate
0%
378%
16%
48%
5%
44%
62%
0%
95%
1500%
20%
11%
10
100 g
300 g
0.25 tsp - 0.5g 1 tbsp - 6.8g
Vitamin C
Vit. C
Vitamin D
Vit. D
Vitamin A
Vit. A
Vitamin E
Vit. E
Vitamin B1
Vit. B1
Vitamin B2
Vit. B2
Vitamin B3
Vit. B3
Vitamin B5
Vit. B5
Vitamin B6
Vit. B6
Vitamin B12
Vit. B12
Vitamin K
Vit. K
Folate
Folate
3%
0%
821%
582%
83%
284%
189%
151%
494%
0%
201%
37%
All nutrients comparison - raw data values
Nutrient
DV% diff.
Vitamin B12
12µg
0µg
500%
Vitamin A
47µg
2463µg
268%
Iron
1.4mg
21.14mg
247%
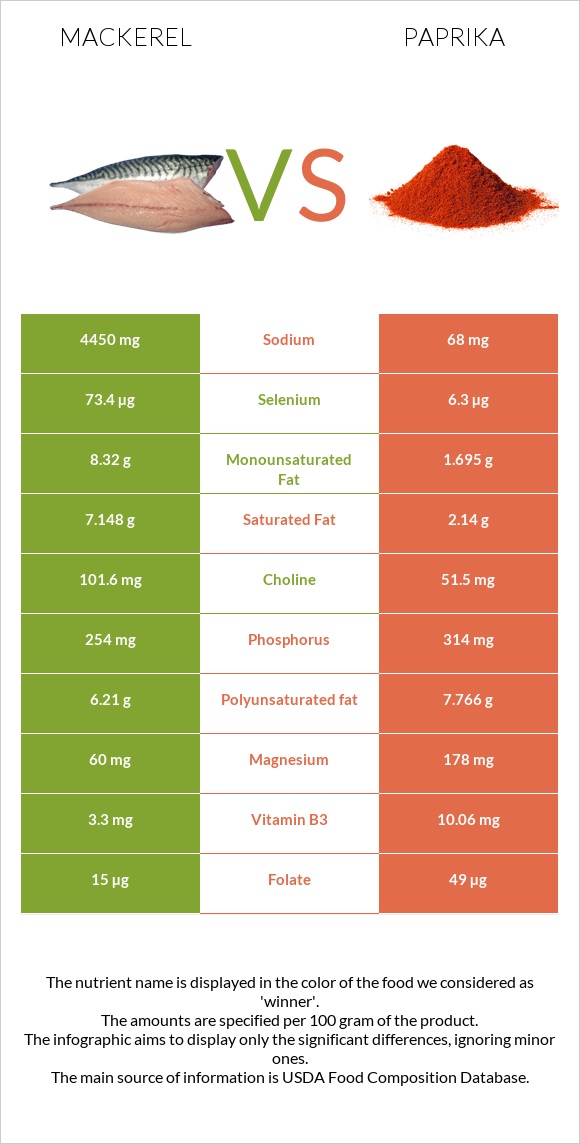
Sodium
4450mg
68mg
191%
Vitamin E
2.38mg
29.1mg
178%
Fiber
0g
34.9g
140%
Vitamin B6
0.41mg
2.141mg
133%
Vitamin D*
1006 IU
0 IU
126%
Vitamin D
25.2µg
0µg
126%
Selenium
73.4µg
6.3µg
122%
Vitamin B2
0.19mg
1.23mg
80%
Manganese
1.59mg
69%
Copper
0.1mg
0.713mg
68%
Vitamin K
7.8µg
80.3µg
60%
Potassium
520mg
2280mg
52%
Vitamin B5
2.51mg
50%
Vitamin B3
3.3mg
10.06mg
42%
Cholesterol
95mg
0mg
32%
Zinc
1.1mg
4.33mg
29%
Magnesium
60mg
178mg
28%
Vitamin B1
0.02mg
0.33mg
26%
Saturated fat
7.148g
2.14g
23%
Fats
25.1g
12.89g
19%
Carbs
0g
53.99g
18%
Monounsaturated fat
8.32g
1.695g
17%
Calcium
66mg
229mg
16%
Polyunsaturated fat
6.21g
7.766g
10%
Protein
18.5g
14.14g
9%
Phosphorus
254mg
314mg
9%
Folate
15µg
49µg
9%
Choline
101.6mg
51.5mg
9%
Fructose
6.71g
8%
Calories
305kcal
282kcal
1%
Vitamin C
0mg
0.9mg
1%
Protein per 100 calories
6.1g
5g
N/A
Calories per 10 g protein
165kcal
199kcal
N/A
Weight per 100 calories
33g
35g
N/A
Unsaturated / Saturated Fat ratio
2
4.4
N/A
Net carbs
0g
19.09g
N/A
Sugar
0g
10.34g
N/A
Tryptophan
0.07mg
0%
Threonine
0.49mg
0%
Isoleucine
0.57mg
0%
Leucine
0.92mg
0%
Lysine
0.69mg
0%
Methionine
0.2mg
0%
Phenylalanine
0.61mg
0%
Valine
0.75mg
0%
Histidine
0.25mg
0%
Omega-3 - EPA
1.619g
0g
N/A
Omega-3 - DHA
2.965g
0g
N/A
Omega-3 - ALA
0.453g
N/A
Omega-3 - DPA
0.391g
0g
N/A
Macronutrient Comparison
Macronutrient breakdown side-by-side comparison
4
19%
25%
43%
13%
Protein:
18.5 g
Fats:
25.1 g
Carbs:
0 g
Water:
43 g
Other:
13.4 g
1
14%
13%
54%
11%
8%
Protein:
14.14 g
Fats:
12.89 g
Carbs:
53.99 g
Water:
11.24 g
Other:
7.74 g
Contains
more
Protein Protein
+30.8%
Contains
more
Fats Fats
+94.7%
Contains
more
Water Water
+282.6%
Contains
more
Other Other
+73.1%
Contains
more
Carbs Carbs
+∞%
Fat Type Comparison
Fat type breakdown side-by-side comparison
1
33%
38%
29%
Saturated fat:
Sat. Fat
7.148 g
Monounsaturated fat:
Mono. Fat
8.32 g
Polyunsaturated fat:
Poly. Fat
6.21 g
2
18%
15%
67%
Saturated fat:
Sat. Fat
2.14 g
Monounsaturated fat:
Mono. Fat
1.695 g
Polyunsaturated fat:
Poly. Fat
7.766 g
Contains
more
Mono. Fat Monounsaturated fat
+390.9%
Contains
less
Sat. Fat Saturated fat
-70.1%
Contains
more
Poly. Fat Polyunsaturated fat
+25.1%