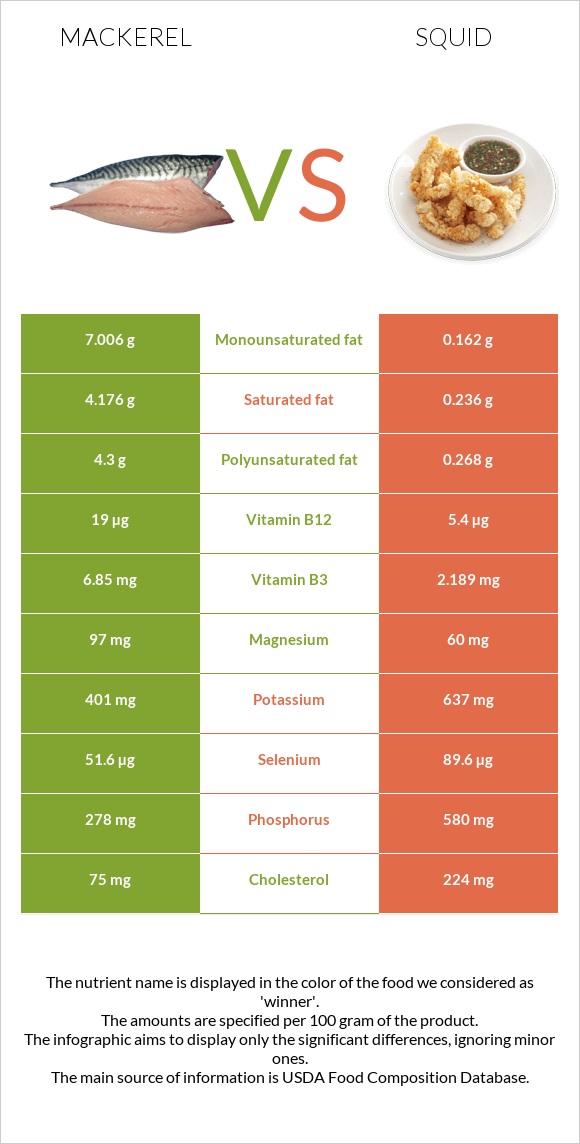
What are the main differences between mackerel and squid? Mackerel is richer in vitamin B12 and vitamin B3, while squid is higher in iron, vitamin B2, copper, selenium, phosphorus, and zinc. Mackerel's daily need coverage for vitamin B12 is 567% higher. Squid has 3 times less vitamin B3 than mackerel. Mackerel has 6.85mg of vitamin B3, while squid has 2.189mg. Mackerel is lower in cholesterol. We used Fish, mackerel, Atlantic, cooked, dry heat and Mollusks, cuttlefish, mixed species, cooked, moist heat types in this comparison.
Infographic
Mineral Comparison
Mineral comparison score is based on the number of minerals by which one or the other food is richer. The "coverage" charts below show how much of the daily needs can be covered by 300 grams of the food.
2
100 g
300 g
3 oz - 85g 1 fillet - 88g
Magnesium
Magnesium
Calcium
Calcium
Potassium
Potassium
Iron
Iron
Copper
Copper
Zinc
Zinc
Phosphorus
Phosphorus
Sodium
Sodium
Manganese
Manganese
Selenium
Selenium
69%
4.5%
35%
59%
31%
26%
119%
11%
2.6%
281%
8
100 g
300 g
3 oz - 85g
Magnesium
Magnesium
Calcium
Calcium
Potassium
Potassium
Iron
Iron
Copper
Copper
Zinc
Zinc
Phosphorus
Phosphorus
Sodium
Sodium
Manganese
Manganese
Selenium
Selenium
43%
54%
56%
407%
333%
94%
249%
97%
27%
489%
Vitamin Comparison
Vitamin comparison score is based on the number of vitamins by which one or the other food is richer. The "coverage" charts below show how much of the daily needs can be covered by 300 grams of the food.
4
100 g
300 g
3 oz - 85g 1 fillet - 88g
Vitamin C
Vit. C
Vitamin D
Vit. D
Vitamin A
Vit. A
Vitamin E
Vit. E
Vitamin B1
Vit. B1
Vitamin B2
Vit. B2
Vitamin B3
Vit. B3
Vitamin B5
Vit. B5
Vitamin B6
Vit. B6
Vitamin B12
Vit. B12
Vitamin K
Vit. K
Folate
Folate
1.3%
0%
18%
0%
40%
95%
128%
59%
106%
2375%
0%
1.5%
4
100 g
300 g
3 oz - 85g
Vitamin C
Vit. C
Vitamin D
Vit. D
Vitamin A
Vit. A
Vitamin E
Vit. E
Vitamin B1
Vit. B1
Vitamin B2
Vit. B2
Vitamin B3
Vit. B3
Vitamin B5
Vit. B5
Vitamin B6
Vit. B6
Vitamin B12
Vit. B12
Vitamin K
Vit. K
Folate
Folate
28%
0%
68%
0%
4.3%
399%
41%
54%
62%
675%
0%
18%
All nutrients comparison - raw data values
Nutrient
DV% diff.
Vitamin B12
19µg
5.4µg
567%
Iron
1.57mg
10.84mg
116%
Vitamin B2
0.412mg
1.729mg
101%
Copper
0.094mg
0.998mg
100%
Selenium
51.6µg
89.6µg
69%
Cholesterol
75mg
224mg
50%
Phosphorus
278mg
580mg
43%
Sodium
83mg
744mg
29%
Vitamin B3
6.85mg
2.189mg
29%
Polyunsaturated fat
4.3g
0.268g
27%
Fats
17.81g
1.4g
25%
Zinc
0.94mg
3.46mg
23%
Saturated fat
4.176g
0.236g
18%
Protein
23.85g
32.48g
17%
Calcium
15mg
180mg
17%
Vitamin A
54µg
203µg
17%
Monounsaturated fat
7.006g
0.162g
17%
Vitamin B6
0.46mg
0.27mg
15%
Vitamin B1
0.159mg
0.017mg
12%
Vitamin C
0.4mg
8.5mg
9%
Magnesium
97mg
60mg
9%
Manganese
0.02mg
0.209mg
8%
Potassium
401mg
637mg
7%
Folate
2µg
24µg
6%
Calories
262kcal
158kcal
5%
Vitamin B5
0.99mg
0.9mg
2%
Carbs
0g
1.64g
1%
Protein per 100 calories
9.1g
21g
N/A
Calories per 10 g protein
110kcal
49kcal
N/A
Weight per 100 calories
38g
63g
N/A
Unsaturated / Saturated Fat ratio
2.7
1.8
N/A
Net carbs
0g
1.64g
N/A
Tryptophan
0.267mg
0.364mg
0%
Threonine
1.045mg
1.398mg
0%
Isoleucine
1.099mg
1.414mg
0%
Leucine
1.938mg
2.287mg
0%
Lysine
2.19mg
2.427mg
0%
Methionine
0.706mg
0.733mg
0%
Phenylalanine
0.931mg
1.164mg
0%
Valine
1.228mg
1.419mg
0%
Histidine
0.702mg
0.624mg
0%
Omega-3 - EPA
0.504g
0.078g
N/A
Omega-3 - DHA
0.699g
0.132g
N/A
Omega-3 - DPA
0.106g
0.012g
N/A
Macronutrient Comparison
Macronutrient breakdown side-by-side comparison
2
24%
18%
53%
5%
Protein:
23.85 g
Fats:
17.81 g
Carbs:
0 g
Water:
53.27 g
Other:
5.07 g
3
32%
61%
3%
Protein:
32.48 g
Fats:
1.4 g
Carbs:
1.64 g
Water:
61.12 g
Other:
3.36 g
Contains
more
Fats Fats
+1172.1%
Contains
more
Other Other
+50.9%
Contains
more
Protein Protein
+36.2%
Contains
more
Carbs Carbs
+∞%
Contains
more
Water Water
+14.7%
Fat Type Comparison
Fat type breakdown side-by-side comparison
2
27%
45%
28%
Saturated fat:
Sat. Fat
4.176 g
Monounsaturated fat:
Mono. Fat
7.006 g
Polyunsaturated fat:
Poly. Fat
4.3 g
1
35%
24%
40%
Saturated fat:
Sat. Fat
0.236 g
Monounsaturated fat:
Mono. Fat
0.162 g
Polyunsaturated fat:
Poly. Fat
0.268 g
Contains
more
Mono. Fat Monounsaturated fat
+4224.7%
Contains
more
Poly. Fat Polyunsaturated fat
+1504.5%
Contains
less
Sat. Fat Saturated fat
-94.3%