Salmon vs. Beef — Health Impact and Nutrition Comparison


Summary
Beef is higher in all macronutrients, including fats, protein, and calories. Despite this, salmon is richer in all essential amino acids and has a more favorable fat profile.
Salmon is the absolute winner in the vitamin category. Salmon is an excellent source of vitamin D and vitamin C, which beef completely lacks. It also contains more B-complex vitamins, as well as 26 times more vitamin A, and 10 times more vitamin E.
Salmon contains higher amounts of potassium, magnesium, and phosphorus, while beef is richer in iron, calcium, zinc, and copper.
Salmon is the preferred choice for low-fat and low-calorie weight loss diets. Overall, it is also a healthier choice for people concerned with cardiovascular diseases, diabetes, and cancer.
Introduction
Salmon and steak are two of the most popular choices for dinner at restaurants. Both are also known as great protein sources. Besides taste and origin, they have many differences in their nutritional compositions and impacts on health. In this article, we will talk about that and much more.
Classification
Salmon classifies as part of the oily fish species known for containing a high level of oils and, therefore, fat-soluble vitamins and omega-3 fatty acids.
Beef, commonly referred to as just steak, is the meat from the skeletal muscles of cattle, that is, cows or bulls.
Steak is popularly known as red meat but is salmon red meat? Despite salmon's red color, fish is considered to be white meat.
Appearance
Salmon and beef are distinctly different from each other by their appearances. Salmon usually has a red or orange hue when raw and loses its color as it gets cooked, becoming closer to shades of pink or white. Salmon meat also has visible wavy white lines called marbling. These lines can appear stronger or be barely visible, depending on whether the fish was farm-raised or wild-caught.
On the other hand, raw beef has a bright red color that gets darker when exposed to oxygen. Beef also has marbling; however, it looks irregular and less orderly compared to salmon. The marbling in beef depends on the cattle, as well as which part of the meat it is.
Taste and Use
Salmon, being high in fats, tastes rich and oily, whereas steak has a more tender and juicy flavor.
Both salmon and beef can be used in similar ways in the kitchen: grilled, broiled, stir-fried, and more.
Beef is arguably more versatile in use. One of the most popular dishes from beef is beef steak or just steak; others include roast beef, burgers, beef stroganoff, casserole, and shepherd's pie. Salmon can also be eaten as a steak or burger. Most often, it's fried, grilled, or broiled and consumed with flavorings and sauce.
Varieties
Several species of fish are combined in the term salmon. The six major species of salmon include the Atlantic, King (Chinook), Sockeye (Red), Coho (Silver), Pink (Humpback), and Chum (Dog, Silverbrite). Depending on the species, the taste and nutrition may differ. The King salmon is the biggest among them, containing the highest percentage of fat. In contrast, Chum contains the lowest amount of fat. The different types have similar contents of protein.
You can also find a difference in salmons depending on whether they were wild-caught or farm-raised. Farm-raised salmon may be higher in certain toxins, contaminants, and antibiotics compared to wild-caught salmon.
There are different varieties of beef based on the cut of the animal. The popular cuts of beef are the chuck (shoulder), brisket (breast), plate (belly), rib, shank (leg), flank (abdominal muscles), loin (back, above the abdomen), and the round (back, above the legs). These varieties can differ in texture, nutrition, and taste.
Based on the level of marbling and maturity, beef is divided into eight grades. The top three grades for beef are Prime, Choice, and Select.
Nutrition
For this article, we are using the nutritional information about farmed Atlantic salmon cooked by dry heating and broiled ground beef with 85% lean meat and 15% fat.
Macronutrients and Calories
Beef is denser in nutrients, as it consists of 58% water, whereas salmon consists of 65%.
Macronutrient Comparison
Contains
more
WaterWater
+11.7%
Contains
more
OtherOther
+17.6%
Contains
more
ProteinProtein
+17.3%
Contains
more
FatsFats
+24.8%
The two foods have an equal average serving size per person of 85g or 3 ounces.
Calories
Beef is higher in most macronutrients and is, therefore, higher in calories compared to salmon. A 100g serving of salmon contains 206 calories, while the same amount of beef has 250 calories.
Protein
Beef is somewhat higher in protein. A 100g serving of beef provides 4g more protein compared to the same serving of salmon.
Beef and salmon, being abundant in protein, contain high levels of all essential amino acids. Even though beef is richer in overall proteins, salmon contains greater amounts of all essential amino acids.
Fats
Beef is also significantly higher in fats.
Beef contains almost 3g more fat per 100g serving than salmon does. Naturally, beef is also higher in cholesterol, by 25mg for every 100g serving.
Salmon fat is considered to be healthier, as the predominant type of fat found in it is polyunsaturated fatty acids, followed by monounsaturated fats. Among those polyunsaturated fats, salmon is rich in omega-3 fatty acids. It is an essential fat with numerous health-beneficial properties.
Beef fat, on the other hand, consists mainly of saturated and monounsaturated fatty acids, containing very low amounts of polyunsaturated fat.
Fat Type Comparison
Contains
less
Sat. FatSaturated fat
-59.3%
Contains
more
Poly. FatPolyunsaturated fat
+840.7%
Contains
more
Mono. FatMonounsaturated fat
+59.5%
Carbohydrates
Both salmon and beef, like most other meat, contain no carbohydrates.
Vitamins
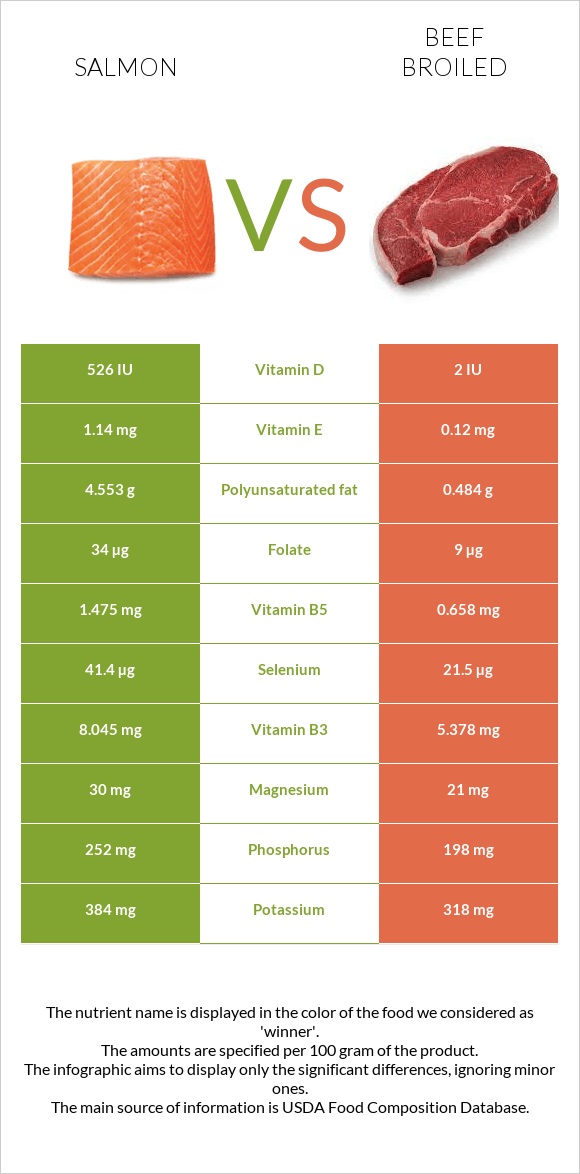
Salmon is undoubtedly the winner in this category, being richer in almost all the vitamins. These include 26 times more vitamin A, 10 times more vitamin E, and all the B-complex vitamins, except for vitamins B2 and B12. Salmon is also an excellent source of vitamin D and vitamin C, which beef completely lacks (1).
However, beef does contain 11 times more vitamin K and a little more vitamin B2.
Salmon and beef provide similar amounts of vitamin B12.
However, if we keep the comparison aside, the actual contents of some of these vitamins per single serving are not significant. For example, even though salmon contains 26 times more vitamin A, the amount of the vitamin per serving is only 230 IU, while the recommended daily need is around 2000-3000 IU.
That said, if we put them in the context of daily recommended needs, both salmon and beef are excellent sources of vitamin B12, vitamin B6, and vitamin B3, while salmon is also a great source of vitamin B5, vitamin B1, and vitamin D.
Vitamin Comparison
Contains
more
Vitamin CVitamin C
+∞%
Contains
more
Vitamin DVitamin D
+∞%
Contains
more
Vitamin AVitamin A
+2200%
Contains
more
Vitamin EVitamin E
+850%
Contains
more
Vitamin B1Vitamin B1
+639.1%
Contains
more
Vitamin B3Vitamin B3
+49.6%
Contains
more
Vitamin B5Vitamin B5
+124.2%
Contains
more
Vitamin B6Vitamin B6
+69.4%
Contains
more
FolateFolate
+277.8%
Contains
more
Vitamin B2Vitamin B2
+30.4%
Contains
more
Vitamin KVitamin K
+1100%
Minerals
Salmon and beef are both rich in minerals.
Salmon contains higher amounts of selenium, potassium, magnesium, and phosphorus. Salmon is also somewhat lower in sodium.
On the other hand, beef is richer in iron, calcium, zinc, and copper.
However, the most significant minerals in terms of their contribution to the daily need found in salmon are only selenium and phosphorus, while in beef, it includes both selenium and phosphorus, but also iron and zinc.
Mineral Comparison
Contains
more
MagnesiumMagnesium
+42.9%
Contains
more
PotassiumPotassium
+20.8%
Contains
more
PhosphorusPhosphorus
+27.3%
Contains
less
SodiumSodium
-15.3%
Contains
more
ManganeseManganese
+33.3%
Contains
more
SeleniumSelenium
+92.6%
Contains
more
CalciumCalcium
+20%
Contains
more
IronIron
+664.7%
Contains
more
CopperCopper
+73.5%
Contains
more
ZincZinc
+1367.4%
Glycemic Index
As salmon and beef do not contain carbohydrates, the glycemic index of these foods is considered to be equal to 0.
Insulin Index
The insulin index can be used to get an understanding of how foods with no glycemic index values impact the insulin levels in the blood.
The insulin index of salmon has not yet been researched; however, beef has a moderate insulin index of 51.
Acidity
Many aspects can alter the pH of meat; however, the acceptable pH value for beef falls within the range of 5.3 to 5.7 (2). This shows us that beef is an acidic product. When the pH value of beef starts to get higher, it indicates decomposition.
The pH value of salmon is a little higher, ranging from 5.4 to 6.5, making salmon slightly acidic (3).
The potential renal acid load or PRAL is another way of measuring acidity. The PRAL value demonstrates how much acid or base the food produces inside the body.
The PRAL value for beef has been calculated to be 12.6, while the PRAL value for salmon is less than half of that–5.9. This means beef is a lot more acidic in the organism compared to salmon.
Weight Loss & Diets
Salmon and beef are highly nutritious foods, also high in calories. Salmon contains fewer calories compared to beef.
Salmon is the preferred choice between the two for low-fat and low-calorie diets. Steak and salmon both fit in a low-carb or low-glycemic index diet.
Unlike beef, salmon can also be consumed on a pescetarian diet.
Despite the high caloric value, a high protein diet rich in red meat, such as beef, has been studied to help with weight loss and improve body composition (4). However, high meat availability has also been correlated to an increased prevalence of obesity (5), whereas a vegetarian diet has been associated with reduced body weight and lower rates of obesity (6).
Adding seafood, including both lean or fatty fish, to a balanced energy-restricted diet may boost weight loss (7). Another study has found the supplementation of a protein found in salmon, called hydrolysate, to positively affect body mass index in overweight subjects (8).
Overall, both salmon and beef are high in calories; however, salmon may have certain anti-obesity properties that make it the better choice between the two on weight loss diets.
Health Impact
Various studies have centered around the correlation between the consumption of seafood and red meat and its negative or positive effects on health. In this section, we will look at some of those studies.
Health Benefits
Cardiovascular Health
The inclusion of lean red meat or partial replacement of carbohydrates with protein in low saturated fat and low sodium diet has significantly decreased total cholesterol and low-density lipoprotein cholesterol levels (9). A similar study showed that high-protein diets, with or without red meats, can improve cardiometabolic health (4).
Supplementation of fish products rich in omega-3 fatty acids, such as salmon, during a weight loss program, can substantially reduce cardiovascular risk in overweight patients with high blood pressure (10).
Overall, omega-3 fatty acids have been found to possess anti-triglyceridemic, antihypertensive, hemostatic, antiarrhythmic, anti-atherogenic, vasodilatory, and antithrombotic effects (11). They are also beneficial in preventing and treating heart disease by improving the heart's structure and function (11).
Diabetes
Research has suggested that a hypocaloric diet with higher protein content from lean red meats can improve risk markers of type 2 diabetes in obese adults (12).
Lean fish consumption has been studied to have an overall beneficial effect on type 2 diabetes mellitus (13).
Intake of oligopeptide proteins found in salmon skin has significantly reduced fasting blood glucose, expressing antidiabetic activities (14). Salmon skin gelatin has also been studied to enhance insulin secretion and improve glycemic control (15).
Cancer
There is limited suggestive evidence that fish consumption is correlated with a decreased risk of liver and colorectal cancer (16).
Due to contamination, farmed salmon might lead to increased cancer risk. Therefore, individuals concerned with reducing the possibility of cancer may choose wild salmon or farmed salmon with lower contaminant concentrations (17).
Inflammation
Intake of salmon and omega-3 fatty acids has been correlated with lower inflammation levels due to salmon's inhibitory properties on pro-inflammatory compounds (18, 19, 20).
Downsides and Risks
Cardiometabolic Health
In contrast to the potential beneficial effects on heart health, consumption of red and processed meat has been found to lead to an increased risk of cardiometabolic disease and cardiometabolic mortality, as well as all-cause mortality (21).
Substituting processed and unprocessed red meats for high-quality plant products, such as legumes, nuts, and soy, has been associated with a decreased risk of coronary heart disease (22).
Diabetes
Meat consumption has been consistently associated with increased diabetes risk due to its nitrate content and effects on body weight, visceral fat, and intracellular lipids (23).
Another study has come to a similar conclusion that the intake of total cholesterol, animal protein, and heme iron is significantly associated with a higher risk of type 2 diabetes (24).
A diet moderate to low in meat, preferably unprocessed and lean, is recommended for people with diabetes (25).
There is a potential association between an increased risk of diabetes and the consumption of farmed salmon, as it may contain persistent organic pollutants that cause insulin resistance and obesity in mice (26).
Cancer
The consumption of red and processed meats has long been associated with increased cancer risk. In particular, red meat elevates the risk of nasopharynx, colorectal, lung, and pancreas cancer (16), as well as breast and prostate cancer (27). In addition to those, processed meat also increases the chance of esophageal (squamous cell carcinoma) and stomach cancer (non-cardia) (16).
Depending on the preparation methods, the cancerogenic effects of meat can change. When cooked in high heat by grilling, broiling, or barbecuing, both beef and salmon can increase the risk of stomach cancer (16).
Inflammation
Unprocessed and total red meat intake has been associated with higher C-reactive protein levels. Reduction of red meat intake could benefit inflammation (28).
References
- https://fdc.nal.usda.gov/fdc-app.html#/food-details/175167/nutrients
- The effect of pH on beef eating quality
- https://www.webpal.org/SAFE/aaarecovery/2_food_storage/Processing/lacf-phs.htm
- https://www.ncbi.nlm.nih.gov/pmc/articles/PMC5598025/
- https://bmcnutr.biomedcentral.com/articles/10.1186/s40795-016-0063-9
- https://academic.oup.com/nutritionreviews/article/64/4/175/1911289
- https://www.nature.com/articles/0803643
- https://www.researchgate.net/publication/297727596
- https://www.ncbi.nlm.nih.gov/pmc/articles/PMC3238465/
- https://academic.oup.com/ajcn/article/70/5/817/4729086
- https://www.ncbi.nlm.nih.gov/pmc/articles/PMC3712371/
- https://pubmed.ncbi.nlm.nih.gov/31771921/
- https://journals.plos.org/plosone/article?id=10.1371/journal.pone.0089845
- https://pubmed.ncbi.nlm.nih.gov/20541363/
- https://pubmed.ncbi.nlm.nih.gov/25946069/
- https://www.wcrf.org/dietandcancer/exposures/meat-fish-dairy
- https://academic.oup.com/jn/article/135/11/2639/4669888
- https://www.ncbi.nlm.nih.gov/pmc/articles/PMC3712371/
- https://pubmed.ncbi.nlm.nih.gov/20551965/
- https://pubmed.ncbi.nlm.nih.gov/19221636/
- https://jech.bmj.com/content/73/Suppl_1/A15.1
- https://www.acpjournals.org/doi/full/10.7326/M19-0655?journalCode=aim
- https://www.bmj.com/content/371/bmj.m4141
- https://www.ncbi.nlm.nih.gov/pmc/articles/PMC3942738/
- https://care.diabetesjournals.org/content/27/9/2108
- https://care.diabetesjournals.org/content/27/9/2108
- https://journals.plos.org/plosone/article?id=10.1371/journal.pone.0025170
- https://pubmed.ncbi.nlm.nih.gov/19221636/

Infographic
All nutrients comparison - raw data values
| Nutrient | |
|
DV% diff. |
| Vitamin D* | 526 IU | 2 IU | 66% |
| Vitamin D | 13.1µg | 0µg | 66% |
| Zinc | 0.43mg | 6.31mg | 53% |
| Selenium | 41.4µg | 21.5µg | 36% |
| Iron | 0.34mg | 2.6mg | 28% |
| Polyunsaturated fat | 4.553g | 0.484g | 27% |
| Vitamin B1 | 0.34mg | 0.046mg | 25% |
| Vitamin B6 | 0.647mg | 0.382mg | 20% |
| Vitamin B3 | 8.045mg | 5.378mg | 17% |
| Vitamin B5 | 1.475mg | 0.658mg | 16% |
| Saturated fat | 2.397g | 5.895g | 16% |
| Protein | 22.1g | 25.93g | 8% |
| Cholesterol | 63mg | 88mg | 8% |
| Phosphorus | 252mg | 198mg | 8% |
| Vitamin A | 69µg | 3µg | 7% |
| Vitamin E | 1.14mg | 0.12mg | 7% |
| Vitamin B12 | 2.8µg | 2.64µg | 7% |
| Folate | 34µg | 9µg | 6% |
| Monounsaturated fat | 4.181g | 6.668g | 6% |
| Fats | 12.35g | 15.41g | 5% |
| Vitamin C | 3.7mg | 0mg | 4% |
| Copper | 0.049mg | 0.085mg | 4% |
| Vitamin B2 | 0.135mg | 0.176mg | 3% |
| Calories | 206kcal | 250kcal | 2% |
| Magnesium | 30mg | 21mg | 2% |
| Potassium | 384mg | 318mg | 2% |
| Vitamin K | 0.1µg | 1.2µg | 1% |
| Choline | 90.5mg | 82.4mg | 1% |
| Protein per 100 calories | 11g | 10g | N/A |
| Calories per 10 g protein | 93kcal | 96kcal | N/A |
| Weight per 100 calories | 49g | 40g | N/A |
| Unsaturated / Saturated Fat ratio | 3.6 | 1.2 | N/A |
| Calcium | 15mg | 18mg | 0% |
| Sodium | 61mg | 72mg | 0% |
| Manganese | 0.016mg | 0.012mg | 0% |
| Trans fat | 0.572g | N/A | |
| Tryptophan | 0.248mg | 0.094mg | 0% |
| Threonine | 0.969mg | 0.72mg | 0% |
| Isoleucine | 1.018mg | 0.822mg | 0% |
| Leucine | 1.796mg | 1.45mg | 0% |
| Lysine | 2.03mg | 1.54mg | 0% |
| Methionine | 0.654mg | 0.478mg | 0% |
| Phenylalanine | 0.863mg | 0.725mg | 0% |
| Valine | 1.139mg | 0.914mg | 0% |
| Histidine | 0.651mg | 0.604mg | 0% |
| Omega-3 - EPA | 0.69g | 0.003g | N/A |
| Omega-3 - DHA | 1.457g | 0.001g | N/A |
| Omega-3 - ALA | 0.044g | N/A | |
| Omega-3 - DPA | 0.17g | 0.016g | N/A |
| Omega-6 - Gamma-linoleic acid | 0.012g | N/A |
References
All the values for which the sources are not specified explicitly are taken from FDA’s Food Central. The exact link to the food presented on this page can be found below.
- Salmon - https://fdc.nal.usda.gov/fdc-app.html#/food-details/175168/nutrients
- Beef broiled - https://fdc.nal.usda.gov/fdc-app.html#/food-details/174032/nutrients
All the Daily Values are presented for males aged 31-50, for 2000-calorie diets.