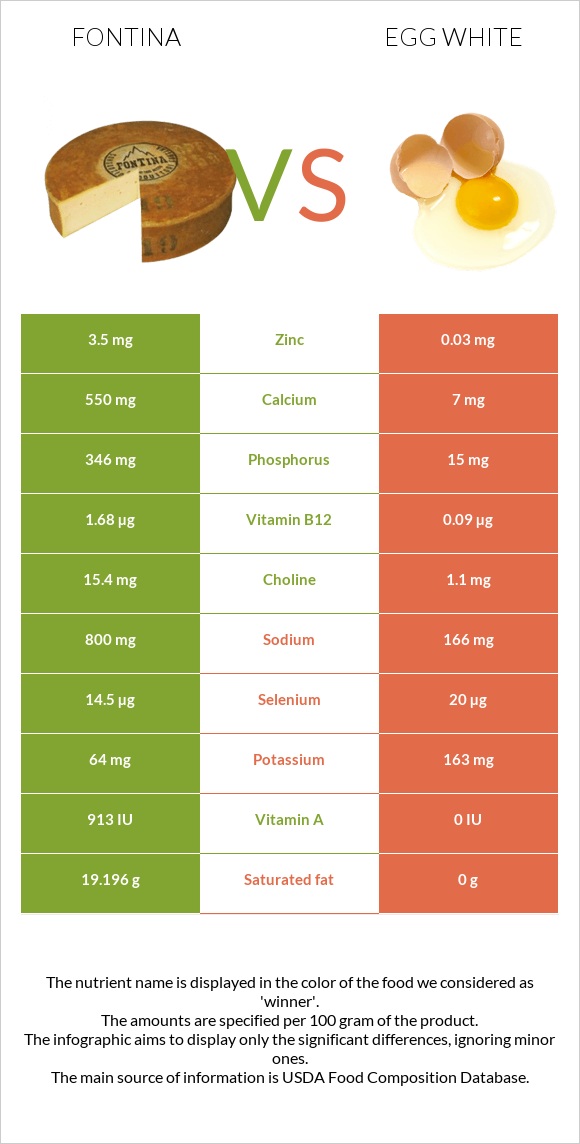
The main differences between fontina and egg whites Fontina has more vitamin B12, calcium, phosphorus, zinc, and vitamin A; however, egg whites have more vitamin B2 and selenium. Daily need coverage for saturated fat for fontina is 96% higher. Egg whites are lower in saturated fat. Fontina has a higher glycemic index than egg whites. Food types used in this article are Cheese, fontina and Egg, white, raw, fresh .
Infographic
Mineral Comparison
Mineral comparison score is based on the number of minerals by which one or the other food is richer. The "coverage" charts below show how much of the daily needs can be covered by 300 grams of the food.
6
100 g
300 g
1 cubic inch - 15g 1 slice (1 oz) - 28g 1 oz - 28.35g 1 cup, shredded - 108g 1 cup, diced - 132g 1 package (8 oz) - 227g
Magnesium
Magnesium
Calcium
Calcium
Potassium
Potassium
Iron
Iron
Copper
Copper
Zinc
Zinc
Phosphorus
Phosphorus
Sodium
Sodium
Manganese
Manganese
Selenium
Selenium
10%
165%
5.6%
8.6%
8.3%
95%
148%
104%
1.8%
79%
3
100 g
300 g
1 large - 33g 1 cup - 243g
Magnesium
Magnesium
Calcium
Calcium
Potassium
Potassium
Iron
Iron
Copper
Copper
Zinc
Zinc
Phosphorus
Phosphorus
Sodium
Sodium
Manganese
Manganese
Selenium
Selenium
7.9%
2.1%
14%
3%
7.7%
0.82%
6.4%
22%
1.4%
109%
Vitamin Comparison
Vitamin comparison score is based on the number of vitamins by which one or the other food is richer. The "coverage" charts below show how much of the daily needs can be covered by 300 grams of the food.
10
100 g
300 g
1 cubic inch - 15g 1 slice (1 oz) - 28g 1 oz - 28.35g 1 cup, shredded - 108g 1 cup, diced - 132g 1 package (8 oz) - 227g
Vitamin C
Vit. C
Vitamin D
Vit. D
Vitamin A
Vit. A
Vitamin E
Vit. E
Vitamin B1
Vit. B1
Vitamin B2
Vit. B2
Vitamin B3
Vit. B3
Vitamin B5
Vit. B5
Vitamin B6
Vit. B6
Vitamin B12
Vit. B12
Vitamin K
Vit. K
Folate
Folate
0%
9%
87%
5.4%
5.3%
47%
2.8%
26%
19%
210%
6.5%
4.5%
1
100 g
300 g
1 large - 33g 1 cup - 243g
Vitamin C
Vit. C
Vitamin D
Vit. D
Vitamin A
Vit. A
Vitamin E
Vit. E
Vitamin B1
Vit. B1
Vitamin B2
Vit. B2
Vitamin B3
Vit. B3
Vitamin B5
Vit. B5
Vitamin B6
Vit. B6
Vitamin B12
Vit. B12
Vitamin K
Vit. K
Folate
Folate
0%
0%
0%
0%
1%
101%
2%
11%
1.2%
11%
0%
3%
All nutrients comparison - raw data values
Nutrient
DV% diff.
Saturated fat
19.196g
0g
87%
Vitamin B12
1.68µg
0.09µg
66%
Calcium
550mg
7mg
54%
Fats
31.14g
0.17g
48%
Phosphorus
346mg
15mg
47%
Cholesterol
116mg
0mg
39%
Zinc
3.5mg
0.03mg
32%
Protein
25.6g
10.9g
29%
Vitamin A
261µg
0µg
29%
Sodium
800mg
166mg
28%
Monounsaturated fat
8.687g
0g
22%
Vitamin B2
0.204mg
0.439mg
18%
Calories
389kcal
52kcal
17%
Polyunsaturated fat
1.654g
0g
11%
Selenium
14.5µg
20µg
10%
Vitamin B6
0.083mg
0.005mg
6%
Vitamin B5
0.429mg
0.19mg
5%
Vitamin D*
23 IU
0 IU
3%
Vitamin D
0.6µg
0µg
3%
Potassium
64mg
163mg
3%
Choline
15.4mg
1.1mg
3%
Iron
0.23mg
0.08mg
2%
Vitamin E
0.27mg
0mg
2%
Vitamin K
2.6µg
0µg
2%
Magnesium
14mg
11mg
1%
Vitamin B1
0.021mg
0.004mg
1%
Folate
6µg
4µg
1%
Protein per 100 calories
6.6g
21g
N/A
Calories per 10 g protein
152kcal
48kcal
N/A
Weight per 100 calories
26g
192g
N/A
Unsaturated / Saturated Fat ratio
0.54
N/A
Net carbs
1.55g
0.73g
N/A
Carbs
1.55g
0.73g
0%
Sugar
1.55g
0.71g
N/A
Copper
0.025mg
0.023mg
0%
Manganese
0.014mg
0.011mg
0%
Vitamin B3
0.15mg
0.105mg
0%
Tryptophan
0.361mg
0.125mg
0%
Threonine
0.935mg
0.449mg
0%
Isoleucine
1.384mg
0.661mg
0%
Leucine
2.664mg
1.016mg
0%
Lysine
2.328mg
0.806mg
0%
Methionine
0.706mg
0.399mg
0%
Phenylalanine
1.497mg
0.686mg
0%
Valine
1.926mg
0.809mg
0%
Histidine
0.959mg
0.29mg
0%
Fructose
0.07g
0%
Macronutrient Comparison
Macronutrient breakdown side-by-side comparison
4
26%
31%
38%
4%
Protein:
25.6 g
Fats:
31.14 g
Carbs:
1.55 g
Water:
37.92 g
Other:
3.79 g
1
11%
88%
Protein:
10.9 g
Fats:
0.17 g
Carbs:
0.73 g
Water:
87.57 g
Other:
0.63 g
Contains
more
Protein Protein
+134.9%
Contains
more
Fats Fats
+18217.6%
Contains
more
Carbs Carbs
+112.3%
Contains
more
Other Other
+501.6%
Contains
more
Water Water
+130.9%