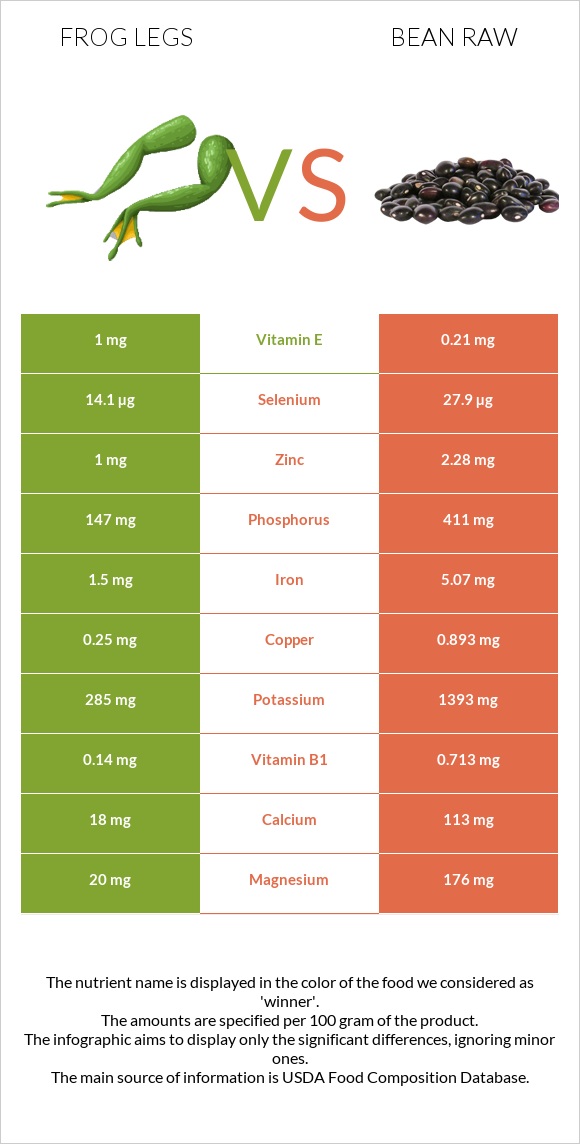
Important differences between frog legs and bean raw Bean raw has more folate, copper, fiber, vitamin B1, iron, phosphorus, magnesium, potassium, vitamin B6, and selenium than frog legs. Bean raw's daily need coverage for folate is 128% more. Bean raw has a higher glycemic index. The glycemic index of bean raw is 33, while the glycemic index of frog legs is 0. The food varieties used in the comparison are Frog legs, raw and Beans, pinto, mature seeds, raw .
Infographic
Mineral Comparison
Mineral comparison score is based on the number of minerals by which one or the other food is richer. The "coverage" charts below show how much of the daily needs can be covered by 300 grams of the food.
0
100 g
300 g
1 leg - 45g
Magnesium
Magnesium
Calcium
Calcium
Potassium
Potassium
Iron
Iron
Copper
Copper
Zinc
Zinc
Phosphorus
Phosphorus
Sodium
Sodium
Manganese
Manganese
Selenium
Selenium
14%
5.4%
25%
56%
83%
27%
63%
7.6%
0%
77%
10
100 g
300 g
1 tbsp - 12g 1 cup - 193g
Magnesium
Magnesium
Calcium
Calcium
Potassium
Potassium
Iron
Iron
Copper
Copper
Zinc
Zinc
Phosphorus
Phosphorus
Sodium
Sodium
Manganese
Manganese
Selenium
Selenium
126%
34%
123%
190%
298%
62%
176%
1.6%
150%
152%
Vitamin Comparison
Vitamin comparison score is based on the number of vitamins by which one or the other food is richer. The "coverage" charts below show how much of the daily needs can be covered by 300 grams of the food.
5
100 g
300 g
1 leg - 45g
Vitamin C
Vit. C
Vitamin D
Vit. D
Vitamin A
Vit. A
Vitamin E
Vit. E
Vitamin B1
Vit. B1
Vitamin B2
Vit. B2
Vitamin B3
Vit. B3
Vitamin B5
Vit. B5
Vitamin B6
Vit. B6
Vitamin B12
Vit. B12
Vitamin K
Vit. K
Folate
Folate
0%
3%
5%
20%
35%
58%
23%
0%
28%
50%
0.25%
11%
6
100 g
300 g
1 tbsp - 12g 1 cup - 193g
Vitamin C
Vit. C
Vitamin D
Vit. D
Vitamin A
Vit. A
Vitamin E
Vit. E
Vitamin B1
Vit. B1
Vitamin B2
Vit. B2
Vitamin B3
Vit. B3
Vitamin B5
Vit. B5
Vitamin B6
Vit. B6
Vitamin B12
Vit. B12
Vitamin K
Vit. K
Folate
Folate
21%
0%
0%
4.2%
178%
49%
22%
47%
109%
0%
14%
394%
All nutrients comparison - raw data values
Nutrient
DV% diff.
Folate
15µg
525µg
128%
Copper
0.25mg
0.893mg
71%
Fiber
0g
15.5g
62%
Manganese
1.148mg
50%
Vitamin B1
0.14mg
0.713mg
48%
Iron
1.5mg
5.07mg
45%
Phosphorus
147mg
411mg
38%
Magnesium
20mg
176mg
37%
Potassium
285mg
1393mg
33%
Vitamin B6
0.12mg
0.474mg
27%
Selenium
14.1µg
27.9µg
25%
Carbs
0g
62.55g
21%
Cholesterol
50mg
0mg
17%
Vitamin B12
0.4µg
0µg
17%
Vitamin B5
0.785mg
16%
Calories
73kcal
347kcal
14%
Starch
34.17g
14%
Zinc
1mg
2.28mg
12%
Protein
16.4g
21.42g
10%
Calcium
18mg
113mg
10%
Vitamin C
0mg
6.3mg
7%
Vitamin E
1mg
0.21mg
5%
Vitamin K
0.1µg
5.6µg
5%
Vitamin B2
0.25mg
0.212mg
3%
Sodium
58mg
12mg
2%
Vitamin A
15µg
0µg
2%
Polyunsaturated fat
0.102g
0.407g
2%
Fats
0.3g
1.23g
1%
Vitamin D*
8 IU
0 IU
1%
Vitamin D
0.2µg
0µg
1%
Saturated fat
0.076g
0.235g
1%
Protein per 100 calories
22g
6.2g
N/A
Calories per 10 g protein
45kcal
162kcal
N/A
Weight per 100 calories
137g
29g
N/A
Net carbs
0g
47.05g
N/A
Sugar
0g
2.11g
N/A
Vitamin B3
1.2mg
1.174mg
0%
Choline
65mg
66.2mg
0%
Monounsaturated fat
0.053g
0.229g
0%
Tryptophan
0.237mg
0%
Threonine
0.81mg
0%
Isoleucine
0.871mg
0%
Leucine
1.558mg
0%
Lysine
1.356mg
0%
Methionine
0.259mg
0%
Phenylalanine
1.095mg
0%
Valine
0.998mg
0%
Histidine
0.556mg
0%
Omega-3 - EPA
0.014g
0g
N/A
Omega-3 - DHA
0.02g
0g
N/A
Omega-3 - DPA
0.007g
0g
N/A
Macronutrient Comparison
Macronutrient breakdown side-by-side comparison
1
16%
82%
Protein:
16.4 g
Fats:
0.3 g
Carbs:
0 g
Water:
81.9 g
Other:
1.4 g
4
21%
63%
11%
3%
Protein:
21.42 g
Fats:
1.23 g
Carbs:
62.55 g
Water:
11.33 g
Other:
3.47 g
Contains
more
Water Water
+622.9%
Contains
more
Protein Protein
+30.6%
Contains
more
Fats Fats
+310%
Contains
more
Carbs Carbs
+∞%
Contains
more
Other Other
+147.9%
Fat Type Comparison
Fat type breakdown side-by-side comparison
1
33%
23%
44%
Saturated fat:
Sat. Fat
0.076 g
Monounsaturated fat:
Mono. Fat
0.053 g
Polyunsaturated fat:
Poly. Fat
0.102 g
2
27%
26%
47%
Saturated fat:
Sat. Fat
0.235 g
Monounsaturated fat:
Mono. Fat
0.229 g
Polyunsaturated fat:
Poly. Fat
0.407 g
Contains
less
Sat. Fat Saturated fat
-67.7%
Contains
more
Mono. Fat Monounsaturated fat
+332.1%
Contains
more
Poly. Fat Polyunsaturated fat
+299%