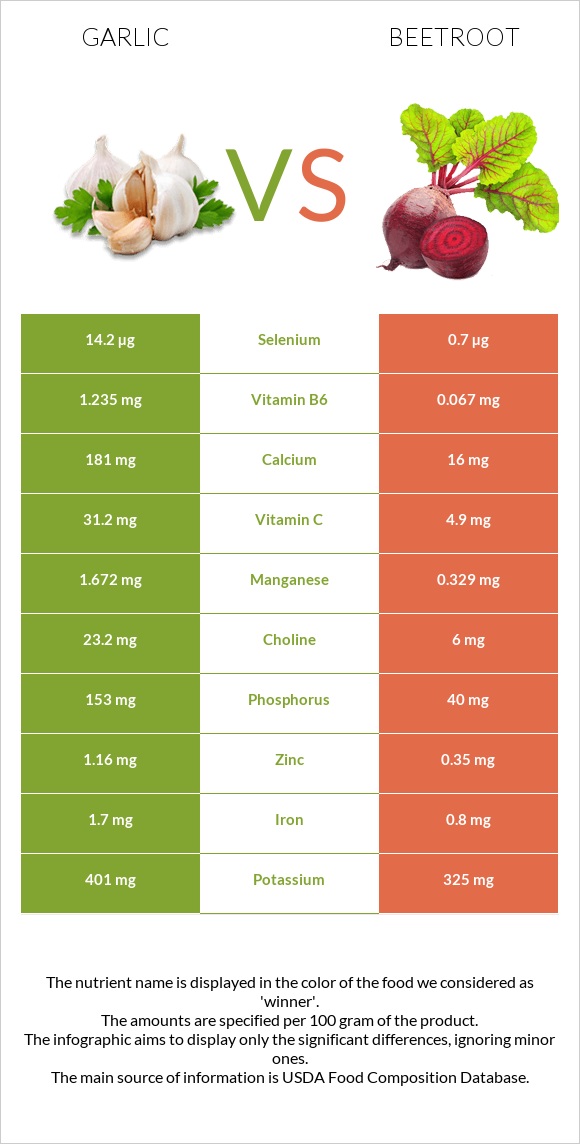
A recap on the differences between garlic and beetroot Garlic has more vitamin B6, manganese, vitamin C, copper, selenium, calcium, phosphorus, vitamin B1, and iron; however, beetroot is higher in folate. Garlic covers your daily vitamin B6 needs 90% more than beetroot. Beetroot contains 20 times less selenium than garlic. Garlic contains 14.2µg of selenium, while beetroot contains 0.7µg. The glycemic index of beetroot is higher. Food varieties used in this article are Garlic, raw and Beets, raw .
Infographic
Mineral Comparison
Mineral comparison score is based on the number of minerals by which one or the other food is richer. The "coverage" charts below show how much of the daily needs can be covered by 300 grams of the food.
9
100 g
300 g
1 tsp - 2.8g 1 clove - 3g 3 cloves - 9g 1 cup - 136g
Magnesium
Magnesium
Calcium
Calcium
Potassium
Potassium
Iron
Iron
Copper
Copper
Zinc
Zinc
Phosphorus
Phosphorus
Sodium
Sodium
Manganese
Manganese
Selenium
Selenium
18%
54%
35%
64%
100%
32%
66%
2.2%
218%
77%
0
100 g
300 g
1 beet (2" dia) - 82g 1 cup - 136g
Magnesium
Magnesium
Calcium
Calcium
Potassium
Potassium
Iron
Iron
Copper
Copper
Zinc
Zinc
Phosphorus
Phosphorus
Sodium
Sodium
Manganese
Manganese
Selenium
Selenium
16%
4.8%
29%
30%
25%
9.5%
17%
10%
43%
3.8%
Vitamin Comparison
Vitamin comparison score is based on the number of vitamins by which one or the other food is richer. The "coverage" charts below show how much of the daily needs can be covered by 300 grams of the food.
8
100 g
300 g
1 tsp - 2.8g 1 clove - 3g 3 cloves - 9g 1 cup - 136g
Vitamin C
Vit. C
Vitamin D
Vit. D
Vitamin A
Vit. A
Vitamin E
Vit. E
Vitamin B1
Vit. B1
Vitamin B2
Vit. B2
Vitamin B3
Vit. B3
Vitamin B5
Vit. B5
Vitamin B6
Vit. B6
Vitamin B12
Vit. B12
Vitamin K
Vit. K
Folate
Folate
104%
0%
0%
1.6%
50%
25%
13%
36%
285%
0%
4.3%
2.3%
2
100 g
300 g
1 beet (2" dia) - 82g 1 cup - 136g
Vitamin C
Vit. C
Vitamin D
Vit. D
Vitamin A
Vit. A
Vitamin E
Vit. E
Vitamin B1
Vit. B1
Vitamin B2
Vit. B2
Vitamin B3
Vit. B3
Vitamin B5
Vit. B5
Vitamin B6
Vit. B6
Vitamin B12
Vit. B12
Vitamin K
Vit. K
Folate
Folate
16%
0%
0.67%
0.8%
7.8%
9.2%
6.3%
9.3%
15%
0%
0.5%
82%
All nutrients comparison - raw data values
Nutrient
DV% diff.
Vitamin B6
1.235mg
0.067mg
90%
Manganese
1.672mg
0.329mg
58%
Vitamin C
31.2mg
4.9mg
29%
Folate
3µg
109µg
27%
Copper
0.299mg
0.075mg
25%
Selenium
14.2µg
0.7µg
25%
Calcium
181mg
16mg
17%
Phosphorus
153mg
40mg
16%
Vitamin B1
0.2mg
0.031mg
14%
Iron
1.7mg
0.8mg
11%
Protein
6.36g
1.61g
10%
Vitamin B5
0.596mg
0.155mg
9%
Carbs
33.06g
9.56g
8%
Zinc
1.16mg
0.35mg
7%
Calories
149kcal
43kcal
5%
Vitamin B2
0.11mg
0.04mg
5%
Fiber
2.1g
2.8g
3%
Sodium
17mg
78mg
3%
Choline
23.2mg
6mg
3%
Potassium
401mg
325mg
2%
Vitamin B3
0.7mg
0.334mg
2%
Fats
0.5g
0.17g
1%
Vitamin K
1.7µg
0.2µg
1%
Polyunsaturated fat
0.249g
0.06g
1%
Protein per 100 calories
4.3g
3.7g
N/A
Calories per 10 g protein
234kcal
267kcal
N/A
Weight per 100 calories
67g
233g
N/A
Net carbs
30.96g
6.76g
N/A
Magnesium
25mg
23mg
0%
Sugar
1g
6.76g
N/A
Vitamin A
0µg
2µg
0%
Vitamin E
0.08mg
0.04mg
0%
Saturated fat
0.089g
0.027g
0%
Monounsaturated fat
0.011g
0.032g
0%
Tryptophan
0.066mg
0.019mg
0%
Threonine
0.157mg
0.047mg
0%
Isoleucine
0.217mg
0.048mg
0%
Leucine
0.308mg
0.068mg
0%
Lysine
0.273mg
0.058mg
0%
Methionine
0.076mg
0.018mg
0%
Phenylalanine
0.183mg
0.046mg
0%
Valine
0.291mg
0.056mg
0%
Histidine
0.113mg
0.021mg
0%
Macronutrient Comparison
Macronutrient breakdown side-by-side comparison
4
6%
33%
59%
Protein:
6.36 g
Fats:
0.5 g
Carbs:
33.06 g
Water:
58.58 g
Other:
1.5 g
1
10%
88%
Protein:
1.61 g
Fats:
0.17 g
Carbs:
9.56 g
Water:
87.58 g
Other:
1.08 g
Contains
more
Protein Protein
+295%
Contains
more
Fats Fats
+194.1%
Contains
more
Carbs Carbs
+245.8%
Contains
more
Other Other
+38.9%
Contains
more
Water Water
+49.5%
Fat Type Comparison
Fat type breakdown side-by-side comparison
1
26%
3%
71%
Saturated fat:
Sat. Fat
0.089 g
Monounsaturated fat:
Mono. Fat
0.011 g
Polyunsaturated fat:
Poly. Fat
0.249 g
2
23%
27%
50%
Saturated fat:
Sat. Fat
0.027 g
Monounsaturated fat:
Mono. Fat
0.032 g
Polyunsaturated fat:
Poly. Fat
0.06 g
Contains
more
Poly. Fat Polyunsaturated fat
+315%
Contains
less
Sat. Fat Saturated fat
-69.7%
Contains
more
Mono. Fat Monounsaturated fat
+190.9%