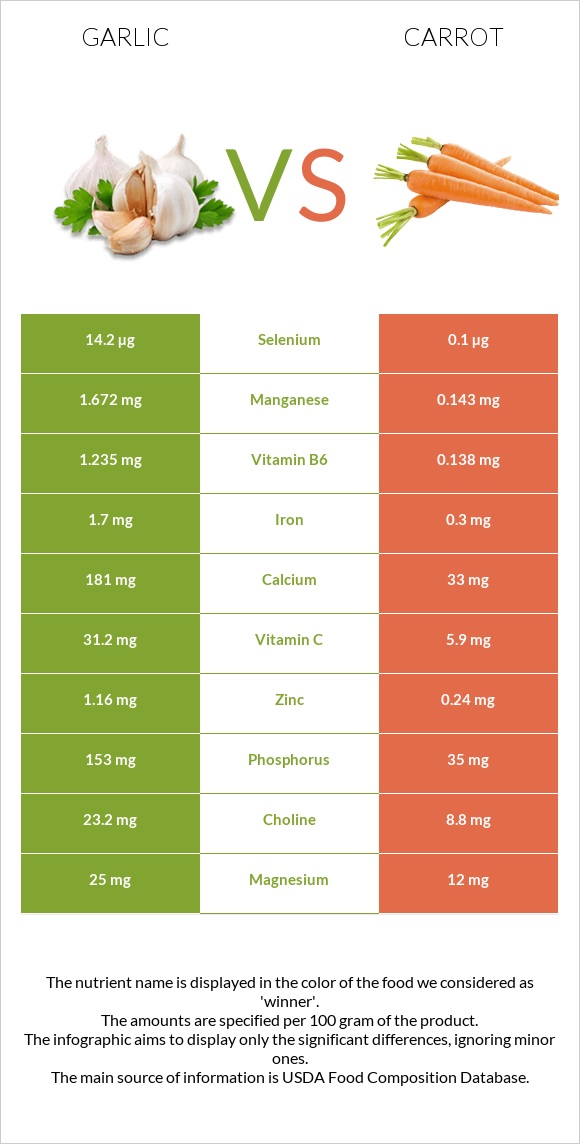
How are garlic and carrots different? Garlic is higher in vitamin B6, manganese, copper, vitamin C, selenium, iron, phosphorus, calcium, and vitamin B1; however, carrots are richer in vitamin A. Daily need coverage for vitamin A for carrots is 334% higher. Garlic contains 142 times more selenium than carrots. While garlic contains 14.2µg of selenium, carrots contain only 0.1µg. Garlic, raw and Carrots, raw are the varieties used in this article.
Infographic
Mineral Comparison
Mineral comparison score is based on the number of minerals by which one or the other food is richer. The "coverage" charts below show how much of the daily needs can be covered by 300 grams of the food.
10
100 g
300 g
1 tsp - 2.8g 1 clove - 3g 3 cloves - 9g 1 cup - 136g
Magnesium
Magnesium
Calcium
Calcium
Potassium
Potassium
Iron
Iron
Copper
Copper
Zinc
Zinc
Phosphorus
Phosphorus
Sodium
Sodium
Manganese
Manganese
Selenium
Selenium
18%
54%
35%
64%
100%
32%
66%
2.2%
218%
77%
0
100 g
300 g
1 slice - 3g 1 strip medium - 4g 1 strip large (3" long) - 7g 1 small (5-1/2" long) - 50g 1 medium - 61g 1 large (7-1/4" to 8-/1/2" long) - 72g 1 cup grated - 110g 1 cup strips or slices - 122g 1 cup chopped - 128g
Magnesium
Magnesium
Calcium
Calcium
Potassium
Potassium
Iron
Iron
Copper
Copper
Zinc
Zinc
Phosphorus
Phosphorus
Sodium
Sodium
Manganese
Manganese
Selenium
Selenium
8.6%
9.9%
28%
11%
15%
6.5%
15%
9%
19%
0.55%
Vitamin Comparison
Vitamin comparison score is based on the number of vitamins by which one or the other food is richer. The "coverage" charts below show how much of the daily needs can be covered by 300 grams of the food.
5
100 g
300 g
1 tsp - 2.8g 1 clove - 3g 3 cloves - 9g 1 cup - 136g
Vitamin C
Vit. C
Vitamin D
Vit. D
Vitamin A
Vit. A
Vitamin E
Vit. E
Vitamin B1
Vit. B1
Vitamin B2
Vit. B2
Vitamin B3
Vit. B3
Vitamin B5
Vit. B5
Vitamin B6
Vit. B6
Vitamin B12
Vit. B12
Vitamin K
Vit. K
Folate
Folate
104%
0%
0%
1.6%
50%
25%
13%
36%
285%
0%
4.3%
2.3%
5
100 g
300 g
1 slice - 3g 1 strip medium - 4g 1 strip large (3" long) - 7g 1 small (5-1/2" long) - 50g 1 medium - 61g 1 large (7-1/4" to 8-/1/2" long) - 72g 1 cup grated - 110g 1 cup strips or slices - 122g 1 cup chopped - 128g
Vitamin C
Vit. C
Vitamin D
Vit. D
Vitamin A
Vit. A
Vitamin E
Vit. E
Vitamin B1
Vit. B1
Vitamin B2
Vit. B2
Vitamin B3
Vit. B3
Vitamin B5
Vit. B5
Vitamin B6
Vit. B6
Vitamin B12
Vit. B12
Vitamin K
Vit. K
Folate
Folate
20%
0%
278%
13%
17%
13%
18%
16%
32%
0%
33%
14%
All nutrients comparison - raw data values
Nutrient
DV% diff.
Vitamin A
0µg
835µg
93%
Vitamin B6
1.235mg
0.138mg
84%
Manganese
1.672mg
0.143mg
66%
Vitamin C
31.2mg
5.9mg
28%
Copper
0.299mg
0.045mg
28%
Selenium
14.2µg
0.1µg
26%
Iron
1.7mg
0.3mg
18%
Phosphorus
153mg
35mg
17%
Calcium
181mg
33mg
15%
Protein
6.36g
0.93g
11%
Vitamin B1
0.2mg
0.066mg
11%
Vitamin K
1.7µg
13.2µg
10%
Carbs
33.06g
9.58g
8%
Zinc
1.16mg
0.24mg
8%
Vitamin B5
0.596mg
0.273mg
6%
Calories
149kcal
41kcal
5%
Vitamin E
0.08mg
0.66mg
4%
Vitamin B2
0.11mg
0.058mg
4%
Folate
3µg
19µg
4%
Magnesium
25mg
12mg
3%
Fiber
2.1g
2.8g
3%
Choline
23.2mg
8.8mg
3%
Potassium
401mg
320mg
2%
Sodium
17mg
69mg
2%
Vitamin B3
0.7mg
0.983mg
2%
Starch
1.43g
1%
Polyunsaturated fat
0.249g
0.117g
1%
Fructose
0.55g
1%
Protein per 100 calories
4.3g
2.3g
N/A
Calories per 10 g protein
234kcal
441kcal
N/A
Weight per 100 calories
67g
244g
N/A
Fats
0.5g
0.24g
0%
Net carbs
30.96g
6.78g
N/A
Sugar
1g
4.74g
N/A
Saturated fat
0.089g
0.037g
0%
Monounsaturated fat
0.011g
0.014g
0%
Tryptophan
0.066mg
0.012mg
0%
Threonine
0.157mg
0.191mg
0%
Isoleucine
0.217mg
0.077mg
0%
Leucine
0.308mg
0.102mg
0%
Lysine
0.273mg
0.101mg
0%
Methionine
0.076mg
0.02mg
0%
Phenylalanine
0.183mg
0.061mg
0%
Valine
0.291mg
0.069mg
0%
Histidine
0.113mg
0.04mg
0%
Macronutrient Comparison
Macronutrient breakdown side-by-side comparison
4
6%
33%
59%
Protein:
6.36 g
Fats:
0.5 g
Carbs:
33.06 g
Water:
58.58 g
Other:
1.5 g
1
10%
88%
Protein:
0.93 g
Fats:
0.24 g
Carbs:
9.58 g
Water:
88.29 g
Other:
0.96 g
Contains
more
Protein Protein
+583.9%
Contains
more
Fats Fats
+108.3%
Contains
more
Carbs Carbs
+245.1%
Contains
more
Other Other
+56.3%
Contains
more
Water Water
+50.7%
Fat Type Comparison
Fat type breakdown side-by-side comparison
1
26%
3%
71%
Saturated fat:
Sat. Fat
0.089 g
Monounsaturated fat:
Mono. Fat
0.011 g
Polyunsaturated fat:
Poly. Fat
0.249 g
2
22%
8%
70%
Saturated fat:
Sat. Fat
0.037 g
Monounsaturated fat:
Mono. Fat
0.014 g
Polyunsaturated fat:
Poly. Fat
0.117 g
Contains
more
Poly. Fat Polyunsaturated fat
+112.8%
Contains
less
Sat. Fat Saturated fat
-58.4%
Contains
more
Mono. Fat Monounsaturated fat
+27.3%