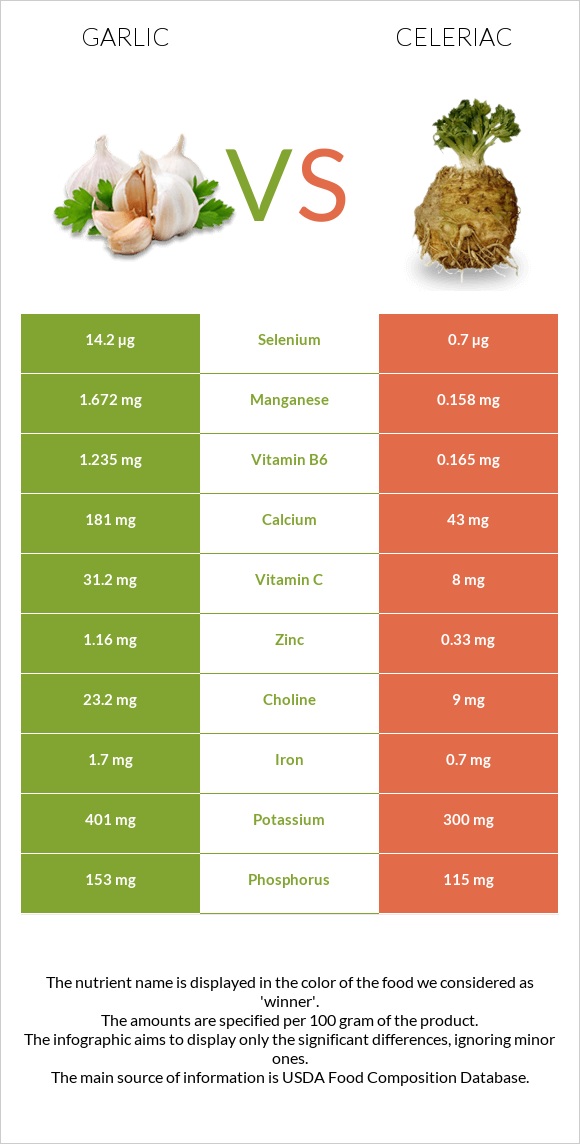
What are the main differences between garlic and celeriac? Garlic is richer in vitamin B6, manganese, vitamin C, copper, selenium, calcium, vitamin B1, iron, and zinc, yet celeriac is richer in vitamin K. Garlic's daily need coverage for vitamin B6 is 82% higher. Garlic has 20 times more selenium than celeriac. Garlic has 14.2µg of selenium, while celeriac has 0.7µg. We used Garlic, raw and Celeriac, raw types in this comparison.
Infographic
Mineral Comparison
Mineral comparison score is based on the number of minerals by which one or the other food is richer. The "coverage" charts below show how much of the daily needs can be covered by 300 grams of the food.
10
100 g
300 g
1 tsp - 2.8g 1 clove - 3g 3 cloves - 9g 1 cup - 136g
Magnesium
Magnesium
Calcium
Calcium
Potassium
Potassium
Iron
Iron
Copper
Copper
Zinc
Zinc
Phosphorus
Phosphorus
Sodium
Sodium
Manganese
Manganese
Selenium
Selenium
18%
54%
35%
64%
100%
32%
66%
2.2%
218%
77%
0
100 g
300 g
1 cup - 156g
Magnesium
Magnesium
Calcium
Calcium
Potassium
Potassium
Iron
Iron
Copper
Copper
Zinc
Zinc
Phosphorus
Phosphorus
Sodium
Sodium
Manganese
Manganese
Selenium
Selenium
14%
13%
26%
26%
23%
9%
49%
13%
21%
3.8%
Vitamin Comparison
Vitamin comparison score is based on the number of vitamins by which one or the other food is richer. The "coverage" charts below show how much of the daily needs can be covered by 300 grams of the food.
5
100 g
300 g
1 tsp - 2.8g 1 clove - 3g 3 cloves - 9g 1 cup - 136g
Vitamin C
Vit. C
Vitamin D
Vit. D
Vitamin A
Vit. A
Vitamin E
Vit. E
Vitamin B1
Vit. B1
Vitamin B2
Vit. B2
Vitamin B3
Vit. B3
Vitamin B5
Vit. B5
Vitamin B6
Vit. B6
Vitamin B12
Vit. B12
Vitamin K
Vit. K
Folate
Folate
104%
0%
0%
1.6%
50%
25%
13%
36%
285%
0%
4.3%
2.3%
3
100 g
300 g
1 cup - 156g
Vitamin C
Vit. C
Vitamin D
Vit. D
Vitamin A
Vit. A
Vitamin E
Vit. E
Vitamin B1
Vit. B1
Vitamin B2
Vit. B2
Vitamin B3
Vit. B3
Vitamin B5
Vit. B5
Vitamin B6
Vit. B6
Vitamin B12
Vit. B12
Vitamin K
Vit. K
Folate
Folate
27%
0%
0%
7.2%
13%
14%
13%
21%
38%
0%
103%
6%
All nutrients comparison - raw data values
Nutrient
DV% diff.
Vitamin B6
1.235mg
0.165mg
82%
Manganese
1.672mg
0.158mg
66%
Vitamin K
1.7µg
41µg
33%
Vitamin C
31.2mg
8mg
26%
Copper
0.299mg
0.07mg
25%
Selenium
14.2µg
0.7µg
25%
Calcium
181mg
43mg
14%
Iron
1.7mg
0.7mg
13%
Vitamin B1
0.2mg
0.05mg
13%
Protein
6.36g
1.5g
10%
Carbs
33.06g
9.2g
8%
Zinc
1.16mg
0.33mg
8%
Calories
149kcal
42kcal
5%
Phosphorus
153mg
115mg
5%
Vitamin B5
0.596mg
0.352mg
5%
Sodium
17mg
100mg
4%
Vitamin B2
0.11mg
0.06mg
4%
Potassium
401mg
300mg
3%
Choline
23.2mg
9mg
3%
Vitamin E
0.08mg
0.36mg
2%
Magnesium
25mg
20mg
1%
Fiber
2.1g
1.8g
1%
Folate
3µg
8µg
1%
Polyunsaturated fat
0.249g
0.148g
1%
Protein per 100 calories
4.3g
3.6g
N/A
Calories per 10 g protein
234kcal
280kcal
N/A
Weight per 100 calories
67g
238g
N/A
Fats
0.5g
0.3g
0%
Net carbs
30.96g
7.4g
N/A
Sugar
1g
1.6g
N/A
Vitamin B3
0.7mg
0.7mg
0%
Saturated fat
0.089g
0.079g
0%
Monounsaturated fat
0.011g
0.058g
0%
Tryptophan
0.066mg
0%
Threonine
0.157mg
0%
Isoleucine
0.217mg
0%
Leucine
0.308mg
0%
Lysine
0.273mg
0%
Methionine
0.076mg
0%
Phenylalanine
0.183mg
0%
Valine
0.291mg
0%
Histidine
0.113mg
0%
Macronutrient Comparison
Macronutrient breakdown side-by-side comparison
4
6%
33%
59%
Protein:
6.36 g
Fats:
0.5 g
Carbs:
33.06 g
Water:
58.58 g
Other:
1.5 g
1
9%
88%
Protein:
1.5 g
Fats:
0.3 g
Carbs:
9.2 g
Water:
88 g
Other:
1 g
Contains
more
Protein Protein
+324%
Contains
more
Fats Fats
+66.7%
Contains
more
Carbs Carbs
+259.3%
Contains
more
Other Other
+50%
Contains
more
Water Water
+50.2%
Fat Type Comparison
Fat type breakdown side-by-side comparison
1
26%
3%
71%
Saturated fat:
Sat. Fat
0.089 g
Monounsaturated fat:
Mono. Fat
0.011 g
Polyunsaturated fat:
Poly. Fat
0.249 g
2
28%
20%
52%
Saturated fat:
Sat. Fat
0.079 g
Monounsaturated fat:
Mono. Fat
0.058 g
Polyunsaturated fat:
Poly. Fat
0.148 g
Contains
more
Poly. Fat Polyunsaturated fat
+68.2%
Contains
less
Sat. Fat Saturated fat
-11.2%
Contains
more
Mono. Fat Monounsaturated fat
+427.3%