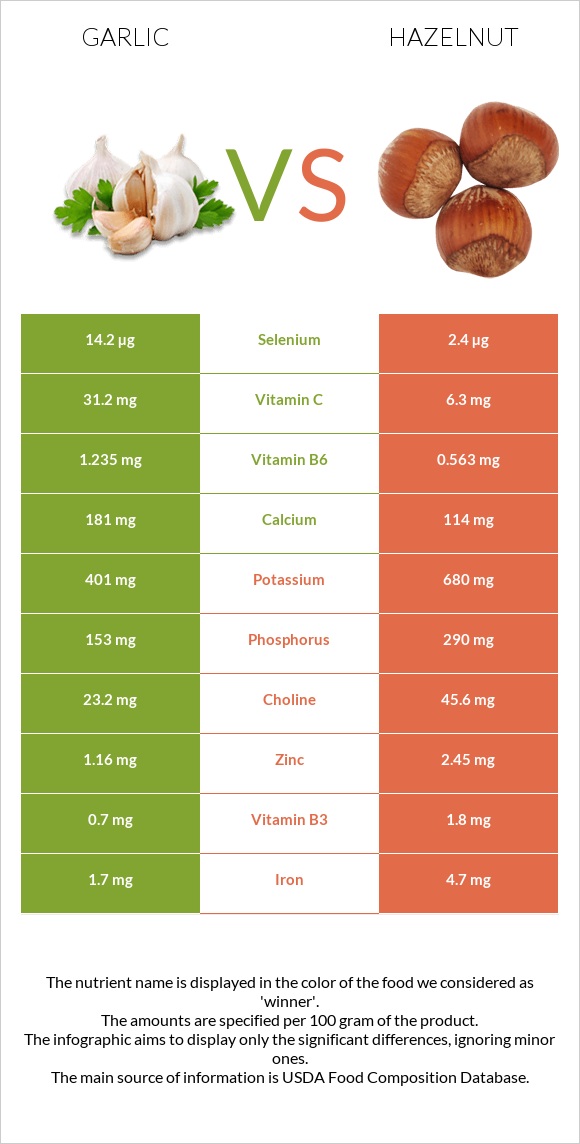
A recap on the differences between garlic and hazelnut Garlic has more vitamin B6 and vitamin C; however, hazelnut is higher in manganese, copper, vitamin E, iron, vitamin B1, magnesium, fiber, and folate. Hazelnut covers your daily manganese needs 196% more than garlic. Hazelnut contains 5 times less vitamin C than garlic. Garlic contains 31.2mg of vitamin C, while hazelnut contains 6.3mg. The glycemic index of garlic is higher. Food varieties used in this article are Garlic, raw and Nuts, hazelnuts or filberts .
Infographic
Mineral Comparison
Mineral comparison score is based on the number of minerals by which one or the other food is richer. The "coverage" charts below show how much of the daily needs can be covered by 300 grams of the food.
2
100 g
300 g
1 tsp - 2.8g 1 clove - 3g 3 cloves - 9g 1 cup - 136g
Magnesium
Magnesium
Calcium
Calcium
Potassium
Potassium
Iron
Iron
Copper
Copper
Zinc
Zinc
Phosphorus
Phosphorus
Sodium
Sodium
Manganese
Manganese
Selenium
Selenium
18%
54%
35%
64%
100%
32%
66%
2.2%
218%
77%
8
100 g
300 g
10 nuts - 14g 1 oz (21 whole kernels) - 28.35g 1 cup, ground - 75g 1 cup, chopped - 115g 1 cup, whole - 135g
Magnesium
Magnesium
Calcium
Calcium
Potassium
Potassium
Iron
Iron
Copper
Copper
Zinc
Zinc
Phosphorus
Phosphorus
Sodium
Sodium
Manganese
Manganese
Selenium
Selenium
116%
34%
60%
176%
575%
67%
124%
0%
805%
13%
Vitamin Comparison
Vitamin comparison score is based on the number of vitamins by which one or the other food is richer. The "coverage" charts below show how much of the daily needs can be covered by 300 grams of the food.
2
100 g
300 g
1 tsp - 2.8g 1 clove - 3g 3 cloves - 9g 1 cup - 136g
Vitamin C
Vit. C
Vitamin D
Vit. D
Vitamin A
Vit. A
Vitamin E
Vit. E
Vitamin B1
Vit. B1
Vitamin B2
Vit. B2
Vitamin B3
Vit. B3
Vitamin B5
Vit. B5
Vitamin B6
Vit. B6
Vitamin B12
Vit. B12
Vitamin K
Vit. K
Folate
Folate
104%
0%
0%
1.6%
50%
25%
13%
36%
285%
0%
4.3%
2.3%
7
100 g
300 g
10 nuts - 14g 1 oz (21 whole kernels) - 28.35g 1 cup, ground - 75g 1 cup, chopped - 115g 1 cup, whole - 135g
Vitamin C
Vit. C
Vitamin D
Vit. D
Vitamin A
Vit. A
Vitamin E
Vit. E
Vitamin B1
Vit. B1
Vitamin B2
Vit. B2
Vitamin B3
Vit. B3
Vitamin B5
Vit. B5
Vitamin B6
Vit. B6
Vitamin B12
Vit. B12
Vitamin K
Vit. K
Folate
Folate
21%
0%
0.33%
301%
161%
26%
34%
55%
130%
0%
36%
85%
All nutrients comparison - raw data values
Nutrient
DV% diff.
Manganese
1.672mg
6.175mg
196%
Copper
0.299mg
1.725mg
158%
Monounsaturated fat
0.011g
45.652g
114%
Vitamin E
0.08mg
15.03mg
100%
Fats
0.5g
60.75g
93%
Vitamin B6
1.235mg
0.563mg
52%
Polyunsaturated fat
0.249g
7.92g
51%
Iron
1.7mg
4.7mg
38%
Vitamin B1
0.2mg
0.643mg
37%
Magnesium
25mg
163mg
33%
Fiber
2.1g
9.7g
30%
Vitamin C
31.2mg
6.3mg
28%
Folate
3µg
113µg
28%
Calories
149kcal
628kcal
24%
Selenium
14.2µg
2.4µg
21%
Phosphorus
153mg
290mg
20%
Saturated fat
0.089g
4.464g
20%
Protein
6.36g
14.95g
17%
Zinc
1.16mg
2.45mg
12%
Vitamin K
1.7µg
14.2µg
10%
Potassium
401mg
680mg
8%
Calcium
181mg
114mg
7%
Vitamin B3
0.7mg
1.8mg
7%
Vitamin B5
0.596mg
0.918mg
6%
Carbs
33.06g
16.7g
5%
Choline
23.2mg
45.6mg
4%
Sodium
17mg
0mg
1%
Protein per 100 calories
4.3g
2.4g
N/A
Calories per 10 g protein
234kcal
420kcal
N/A
Weight per 100 calories
67g
16g
N/A
Unsaturated / Saturated Fat ratio
2.9
12
N/A
Net carbs
30.96g
7g
N/A
Sugar
1g
4.34g
N/A
Starch
0.48g
0%
Vitamin A
0µg
1µg
0%
Vitamin B2
0.11mg
0.113mg
0%
Tryptophan
0.066mg
0.193mg
0%
Threonine
0.157mg
0.497mg
0%
Isoleucine
0.217mg
0.545mg
0%
Leucine
0.308mg
1.063mg
0%
Lysine
0.273mg
0.42mg
0%
Methionine
0.076mg
0.221mg
0%
Phenylalanine
0.183mg
0.663mg
0%
Valine
0.291mg
0.701mg
0%
Histidine
0.113mg
0.432mg
0%
Fructose
0.07g
0%
Macronutrient Comparison
Macronutrient breakdown side-by-side comparison
2
6%
33%
59%
Protein:
6.36 g
Fats:
0.5 g
Carbs:
33.06 g
Water:
58.58 g
Other:
1.5 g
3
15%
61%
17%
5%
2%
Protein:
14.95 g
Fats:
60.75 g
Carbs:
16.7 g
Water:
5.31 g
Other:
2.29 g
Contains
more
Carbs Carbs
+98%
Contains
more
Water Water
+1003.2%
Contains
more
Protein Protein
+135.1%
Contains
more
Fats Fats
+12050%
Contains
more
Other Other
+52.7%
Fat Type Comparison
Fat type breakdown side-by-side comparison
1
26%
3%
71%
Saturated fat:
Sat. Fat
0.089 g
Monounsaturated fat:
Mono. Fat
0.011 g
Polyunsaturated fat:
Poly. Fat
0.249 g
2
8%
79%
14%
Saturated fat:
Sat. Fat
4.464 g
Monounsaturated fat:
Mono. Fat
45.652 g
Polyunsaturated fat:
Poly. Fat
7.92 g
Contains
less
Sat. Fat Saturated fat
-98%
Contains
more
Mono. Fat Monounsaturated fat
+414918.2%
Contains
more
Poly. Fat Polyunsaturated fat
+3080.7%