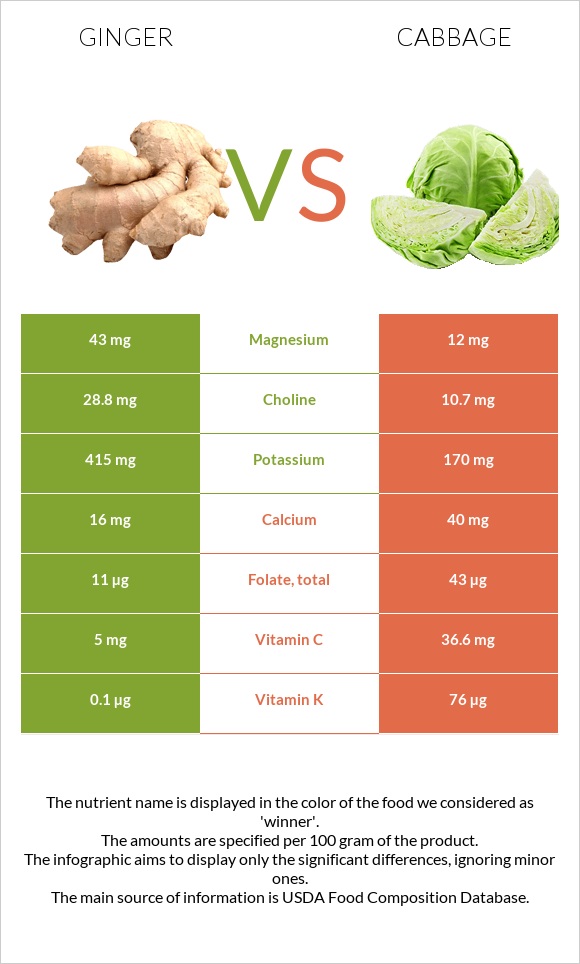
A recap on the differences between ginger and cabbage Ginger is higher in copper, magnesium, and potassium, yet cabbage is higher in vitamin K, vitamin C, and folate. Cabbage covers your daily vitamin K needs 63% more than ginger. Ginger contains 12 times more copper than cabbage. While ginger contains 0.226mg of copper, cabbage contains only 0.019mg. Food varieties used in this article are Ginger root, raw and Cabbage, raw .
Infographic
Mineral Comparison
Mineral comparison score is based on the number of minerals by which one or the other food is richer. The "coverage" charts below show how much of the daily needs can be covered by 300 grams of the food.
9
100 g
300 g
1 tsp - 2g 5 slices (1" dia) - 11g 0.25 cup slices (1" dia) - 24g
Magnesium
Magnesium
Calcium
Calcium
Potassium
Potassium
Iron
Iron
Copper
Copper
Zinc
Zinc
Phosphorus
Phosphorus
Sodium
Sodium
Manganese
Manganese
Selenium
Selenium
31%
4.8%
37%
23%
75%
9.3%
15%
1.7%
30%
3.8%
1
100 g
300 g
1 leaf - 15g 1 leaf, medium - 23g 1 leaf, large - 33g 1 cup, shredded - 70g 1 cup, chopped - 89g 1 head, small (about 4-1/2" dia) - 714g 1 head, medium (about 5-3/4" dia) - 908g 1 head, large (about 7" dia) - 1248g
Magnesium
Magnesium
Calcium
Calcium
Potassium
Potassium
Iron
Iron
Copper
Copper
Zinc
Zinc
Phosphorus
Phosphorus
Sodium
Sodium
Manganese
Manganese
Selenium
Selenium
8.6%
12%
15%
18%
6.3%
4.9%
11%
2.3%
21%
1.6%
Vitamin Comparison
Vitamin comparison score is based on the number of vitamins by which one or the other food is richer. The "coverage" charts below show how much of the daily needs can be covered by 300 grams of the food.
3
100 g
300 g
1 tsp - 2g 5 slices (1" dia) - 11g 0.25 cup slices (1" dia) - 24g
Vitamin C
Vit. C
Vitamin D
Vit. D
Vitamin A
Vit. A
Vitamin E
Vit. E
Vitamin B1
Vit. B1
Vitamin B2
Vit. B2
Vitamin B3
Vit. B3
Vitamin B5
Vit. B5
Vitamin B6
Vit. B6
Vitamin B12
Vit. B12
Vitamin K
Vit. K
Folate
Folate
17%
0%
0%
5.2%
6.3%
7.8%
14%
12%
37%
0%
0.25%
8.3%
6
100 g
300 g
1 leaf - 15g 1 leaf, medium - 23g 1 leaf, large - 33g 1 cup, shredded - 70g 1 cup, chopped - 89g 1 head, small (about 4-1/2" dia) - 714g 1 head, medium (about 5-3/4" dia) - 908g 1 head, large (about 7" dia) - 1248g
Vitamin C
Vit. C
Vitamin D
Vit. D
Vitamin A
Vit. A
Vitamin E
Vit. E
Vitamin B1
Vit. B1
Vitamin B2
Vit. B2
Vitamin B3
Vit. B3
Vitamin B5
Vit. B5
Vitamin B6
Vit. B6
Vitamin B12
Vit. B12
Vitamin K
Vit. K
Folate
Folate
122%
0%
1.7%
3%
15%
9.2%
4.4%
13%
29%
0%
190%
32%
All nutrients comparison - raw data values
Nutrient
DV% diff.
Vitamin K
0.1µg
76µg
63%
Vitamin C
5mg
36.6mg
35%
Copper
0.226mg
0.019mg
23%
Folate
11µg
43µg
8%
Magnesium
43mg
12mg
7%
Potassium
415mg
170mg
7%
Carbs
17.77g
5.8g
4%
Calories
80kcal
25kcal
3%
Manganese
0.229mg
0.16mg
3%
Vitamin B1
0.025mg
0.061mg
3%
Vitamin B3
0.75mg
0.234mg
3%
Vitamin B6
0.16mg
0.124mg
3%
Choline
28.8mg
10.7mg
3%
Calcium
16mg
40mg
2%
Iron
0.6mg
0.47mg
2%
Fiber
2g
2.5g
2%
Fructose
1.45g
2%
Protein
1.82g
1.28g
1%
Fats
0.75g
0.1g
1%
Zinc
0.34mg
0.18mg
1%
Phosphorus
34mg
26mg
1%
Vitamin A
0µg
5µg
1%
Vitamin E
0.26mg
0.15mg
1%
Selenium
0.7µg
0.3µg
1%
Saturated fat
0.203g
0.034g
1%
Polyunsaturated fat
0.154g
0.017g
1%
Protein per 100 calories
2.3g
5.1g
N/A
Calories per 10 g protein
440kcal
195kcal
N/A
Weight per 100 calories
125g
400g
N/A
Net carbs
15.77g
3.3g
N/A
Sugar
1.7g
3.2g
N/A
Sodium
13mg
18mg
0%
Vitamin B2
0.034mg
0.04mg
0%
Vitamin B5
0.203mg
0.212mg
0%
Monounsaturated fat
0.154g
0.017g
0%
Tryptophan
0.012mg
0.011mg
0%
Threonine
0.036mg
0.035mg
0%
Isoleucine
0.051mg
0.03mg
0%
Leucine
0.074mg
0.041mg
0%
Lysine
0.057mg
0.044mg
0%
Methionine
0.013mg
0.012mg
0%
Phenylalanine
0.045mg
0.032mg
0%
Valine
0.073mg
0.042mg
0%
Histidine
0.03mg
0.022mg
0%
Macronutrient Comparison
Macronutrient breakdown side-by-side comparison
4
2%
18%
79%
Protein:
1.82 g
Fats:
0.75 g
Carbs:
17.77 g
Water:
78.89 g
Other:
0.77 g
1
6%
92%
Protein:
1.28 g
Fats:
0.1 g
Carbs:
5.8 g
Water:
92.18 g
Other:
0.64 g
Contains
more
Protein Protein
+42.2%
Contains
more
Fats Fats
+650%
Contains
more
Carbs Carbs
+206.4%
Contains
more
Other Other
+20.3%
Contains
more
Water Water
+16.8%
Fat Type Comparison
Fat type breakdown side-by-side comparison
2
40%
30%
30%
Saturated fat:
Sat. Fat
0.203 g
Monounsaturated fat:
Mono. Fat
0.154 g
Polyunsaturated fat:
Poly. Fat
0.154 g
1
50%
25%
25%
Saturated fat:
Sat. Fat
0.034 g
Monounsaturated fat:
Mono. Fat
0.017 g
Polyunsaturated fat:
Poly. Fat
0.017 g
Contains
more
Mono. Fat Monounsaturated fat
+805.9%
Contains
more
Poly. Fat Polyunsaturated fat
+805.9%
Contains
less
Sat. Fat Saturated fat
-83.3%