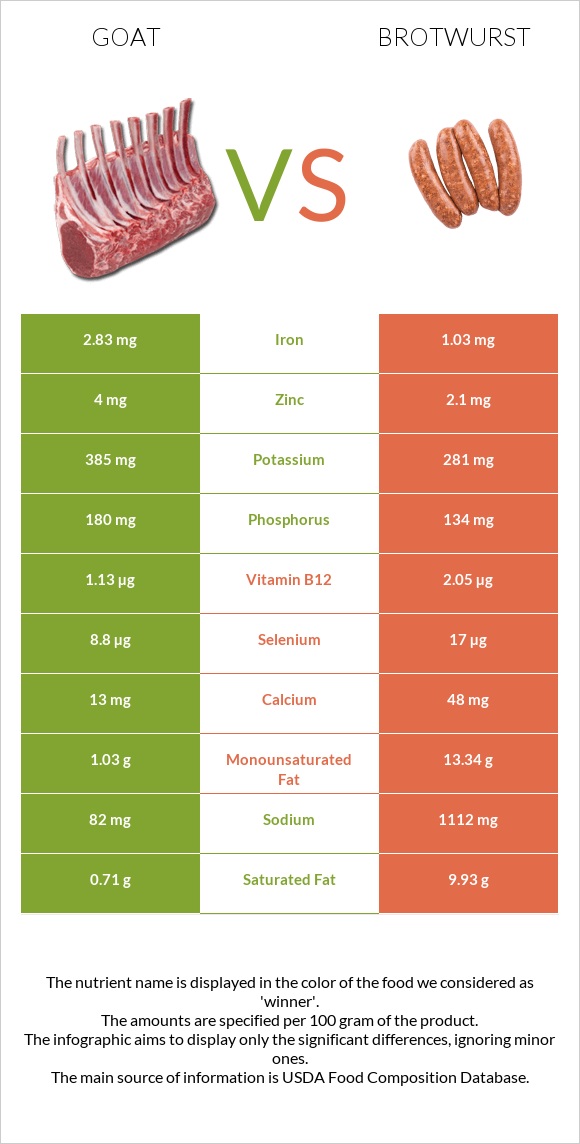
Summary of differences between goat and brotwurst Goat has more iron, vitamin B2, copper, zinc, and phosphorus; however, brotwurst is higher in vitamin B12, selenium, and vitamin B1. Brotwurst covers your daily need for saturated fat, 46% more than goat. Goat has 3 times more copper than brotwurst. While goat has 0.256mg of copper, brotwurst has only 0.08mg. Goat has less sodium. These are the specific foods used in this comparison Goat, raw and Brotwurst, pork, beef, link .
Infographic
Mineral Comparison
Mineral comparison score is based on the number of minerals by which one or the other food is richer. The "coverage" charts below show how much of the daily needs can be covered by 300 grams of the food.
6
100 g
300 g
1 oz - 28.35g 1 lb - 453.6g
Magnesium
Magnesium
Calcium
Calcium
Potassium
Potassium
Iron
Iron
Copper
Copper
Zinc
Zinc
Phosphorus
Phosphorus
Sodium
Sodium
Manganese
Manganese
Selenium
Selenium
0%
3.9%
34%
106%
85%
109%
77%
11%
5%
48%
3
100 g
300 g
1 link - 70g
Magnesium
Magnesium
Calcium
Calcium
Potassium
Potassium
Iron
Iron
Copper
Copper
Zinc
Zinc
Phosphorus
Phosphorus
Sodium
Sodium
Manganese
Manganese
Selenium
Selenium
11%
14%
25%
39%
27%
57%
57%
145%
5.2%
93%
Vitamin Comparison
Vitamin comparison score is based on the number of vitamins by which one or the other food is richer. The "coverage" charts below show how much of the daily needs can be covered by 300 grams of the food.
2
100 g
300 g
1 oz - 28.35g 1 lb - 453.6g
Vitamin C
Vit. C
Vitamin D
Vit. D
Vitamin A
Vit. A
Vitamin E
Vit. E
Vitamin B1
Vit. B1
Vitamin B2
Vit. B2
Vitamin B3
Vit. B3
Vitamin B5
Vit. B5
Vitamin B6
Vit. B6
Vitamin B12
Vit. B12
Vitamin K
Vit. K
Folate
Folate
0%
0%
0%
0%
28%
113%
70%
0%
0%
141%
0%
3.8%
6
100 g
300 g
1 link - 70g
Vitamin C
Vit. C
Vitamin D
Vit. D
Vitamin A
Vit. A
Vitamin E
Vit. E
Vitamin B1
Vit. B1
Vitamin B2
Vit. B2
Vitamin B3
Vit. B3
Vitamin B5
Vit. B5
Vitamin B6
Vit. B6
Vitamin B12
Vit. B12
Vitamin K
Vit. K
Folate
Folate
0%
4.5%
0%
5.4%
63%
53%
62%
3.6%
30%
256%
0%
3.8%
All nutrients comparison - raw data values
Nutrient
DV% diff.
Sodium
82mg
1112mg
45%
Saturated fat
0.71g
9.93g
42%
Fats
2.31g
27.8g
39%
Vitamin B12
1.13µg
2.05µg
38%
Monounsaturated fat
1.03g
13.34g
31%
Iron
2.83mg
1.03mg
23%
Copper
0.256mg
0.08mg
20%
Vitamin B2
0.49mg
0.23mg
20%
Polyunsaturated fat
0.17g
2.83g
18%
Zinc
4mg
2.1mg
17%
Selenium
8.8µg
17µg
15%
Protein
20.6g
14.3g
13%
Vitamin B1
0.11mg
0.25mg
12%
Calories
109kcal
323kcal
11%
Vitamin B6
0.13mg
10%
Phosphorus
180mg
134mg
7%
Magnesium
16mg
4%
Calcium
13mg
48mg
4%
Potassium
385mg
281mg
3%
Vitamin B3
3.75mg
3.3mg
3%
Cholesterol
57mg
63mg
2%
Vitamin D
0.3µg
2%
Vitamin E
0.27mg
2%
Carbs
0g
2.98g
1%
Vitamin D*
11 IU
1%
Vitamin B5
0.06mg
1%
Protein per 100 calories
19g
4.4g
N/A
Calories per 10 g protein
53kcal
226kcal
N/A
Weight per 100 calories
92g
31g
N/A
Unsaturated / Saturated Fat ratio
1.7
1.6
N/A
Net carbs
0g
2.98g
N/A
Sugar
2.98g
N/A
Manganese
0.038mg
0.04mg
0%
Folate
5µg
5µg
0%
Tryptophan
0.306mg
0.13mg
0%
Threonine
0.981mg
0.6mg
0%
Isoleucine
1.042mg
0.61mg
0%
Leucine
1.716mg
1.08mg
0%
Lysine
1.532mg
1.14mg
0%
Methionine
0.552mg
0.37mg
0%
Phenylalanine
0.715mg
0.54mg
0%
Valine
1.103mg
0.68mg
0%
Histidine
0.429mg
0.44mg
0%
Macronutrient Comparison
Macronutrient breakdown side-by-side comparison
2
21%
2%
76%
Protein:
20.6 g
Fats:
2.31 g
Carbs:
0 g
Water:
75.84 g
Other:
1.25 g
3
14%
28%
3%
51%
4%
Protein:
14.3 g
Fats:
27.8 g
Carbs:
2.98 g
Water:
51.3 g
Other:
3.62 g
Contains
more
Protein Protein
+44.1%
Contains
more
Water Water
+47.8%
Contains
more
Fats Fats
+1103.5%
Contains
more
Carbs Carbs
+∞%
Contains
more
Other Other
+189.6%
Fat Type Comparison
Fat type breakdown side-by-side comparison
1
37%
54%
9%
Saturated fat:
Sat. Fat
0.71 g
Monounsaturated fat:
Mono. Fat
1.03 g
Polyunsaturated fat:
Poly. Fat
0.17 g
2
38%
51%
11%
Saturated fat:
Sat. Fat
9.93 g
Monounsaturated fat:
Mono. Fat
13.34 g
Polyunsaturated fat:
Poly. Fat
2.83 g
Contains
less
Sat. Fat Saturated fat
-92.8%
Contains
more
Mono. Fat Monounsaturated fat
+1195.1%
Contains
more
Poly. Fat Polyunsaturated fat
+1564.7%