What are the main differences between green tea and malt? Green tea is richer in vitamin C, while malt is higher in vitamin B12, vitamin B2, phosphorus, selenium, calcium, and vitamin B5. Malt's daily need coverage for vitamin B12 is 18% higher. Malt has 77 times less vitamin C than green tea. Green tea has 7.7mg of vitamin C, while malt has 0.1mg. We used Beverages, tea, green, ready to drink, ginseng, and honey, sweetened and Beverages, Malted drink mix, chocolate, powder, prepared with whole milk types in this comparison.
Infographic
Mineral Comparison
Mineral comparison score is based on the number of minerals by which one or the other food is richer. The "coverage" charts below show how much of the daily needs can be covered by 300 grams of the food.
2
100 g
300 g
1 cup - 260g
Magnesium
Magnesium
Calcium
Calcium
Potassium
Potassium
Iron
Iron
Copper
Copper
Zinc
Zinc
Phosphorus
Phosphorus
Sodium
Sodium
Manganese
Manganese
Selenium
Selenium
0.71%
0.9%
0.44%
0.75%
1.7%
0.27%
0%
0.26%
16%
0%
8
100 g
300 g
1 cup (8 fl oz) - 265g
Magnesium
Magnesium
Calcium
Calcium
Potassium
Potassium
Iron
Iron
Copper
Copper
Zinc
Zinc
Phosphorus
Phosphorus
Sodium
Sodium
Manganese
Manganese
Selenium
Selenium
11%
29%
15%
7.9%
12%
11%
39%
7.8%
10%
29%
Vitamin Comparison
Vitamin comparison score is based on the number of vitamins by which one or the other food is richer. The "coverage" charts below show how much of the daily needs can be covered by 300 grams of the food.
1
100 g
300 g
1 cup - 260g
Vitamin C
Vit. C
Vitamin D
Vit. D
Vitamin A
Vit. A
Vitamin E
Vit. E
Vitamin B1
Vit. B1
Vitamin B2
Vit. B2
Vitamin B3
Vit. B3
Vitamin B5
Vit. B5
Vitamin B6
Vit. B6
Vitamin B12
Vit. B12
Vitamin K
Vit. K
Folate
Folate
26%
0%
0%
0%
10%
0%
0%
0%
0%
0%
0%
0%
10
100 g
300 g
1 cup (8 fl oz) - 265g
Vitamin C
Vit. C
Vitamin D
Vit. D
Vitamin A
Vit. A
Vitamin E
Vit. E
Vitamin B1
Vit. B1
Vitamin B2
Vit. B2
Vitamin B3
Vit. B3
Vitamin B5
Vit. B5
Vitamin B6
Vit. B6
Vitamin B12
Vit. B12
Vitamin K
Vit. K
Folate
Folate
0.33%
0%
8.7%
1.2%
14%
42%
4.9%
21%
11%
53%
0.75%
6.8%
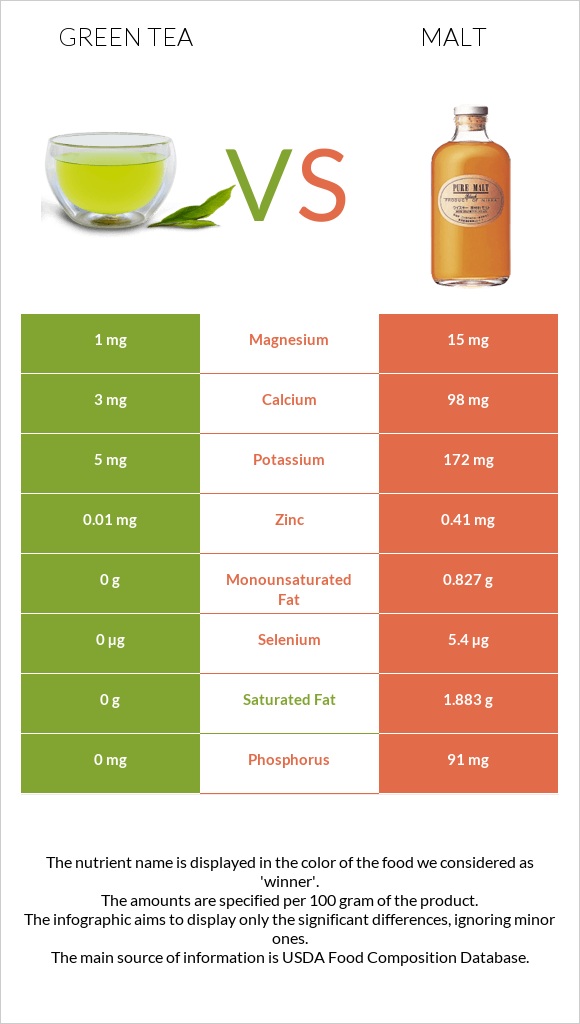
All nutrients comparison - raw data values
Nutrient
DV% diff.
Vitamin B12
0µg
0.42µg
18%
Vitamin B2
0mg
0.184mg
14%
Phosphorus
0mg
91mg
13%
Calcium
3mg
98mg
10%
Selenium
0µg
5.4µg
10%
Saturated fat
0g
1.883g
9%
Vitamin C
7.7mg
0.1mg
8%
Protein
0g
3.37g
7%
Vitamin B5
0mg
0.354mg
7%
Fats
0.18g
3.29g
5%
Potassium
5mg
172mg
5%
Copper
0.005mg
0.037mg
4%
Zinc
0.01mg
0.41mg
4%
Vitamin B6
0mg
0.046mg
4%
Fructose
3.59g
4%
Calories
30kcal
85kcal
3%
Cholesterol
0mg
10mg
3%
Magnesium
1mg
15mg
3%
Sodium
2mg
60mg
3%
Vitamin A
0µg
26µg
3%
Iron
0.02mg
0.21mg
2%
Fiber
0g
0.5g
2%
Manganese
0.12mg
0.08mg
2%
Vitamin B3
0mg
0.259mg
2%
Folate
0µg
9µg
2%
Monounsaturated fat
0g
0.827g
2%
Carbs
7.16g
11.2g
1%
Vitamin B1
0.04mg
0.054mg
1%
Polyunsaturated fat
0g
0.208g
1%
Protein per 100 calories
0g
4g
N/A
Calories per 10 g protein
252kcal
N/A
Weight per 100 calories
333g
118g
N/A
Unsaturated / Saturated Fat ratio
0.55
N/A
Net carbs
7.16g
10.7g
N/A
Sugar
6.87g
6.68g
N/A
Vitamin E
0mg
0.06mg
0%
Vitamin K
0µg
0.3µg
0%
Tryptophan
0.074mg
0%
Threonine
0.143mg
0%
Isoleucine
0.165mg
0%
Leucine
0.268mg
0%
Lysine
0.142mg
0%
Methionine
0.074mg
0%
Phenylalanine
0.15mg
0%
Valine
0.193mg
0%
Histidine
0.077mg
0%
Caffeine
4mg
3mg
0%
Macronutrient Comparison
Macronutrient breakdown side-by-side comparison
1
7%
93%
Protein:
0 g
Fats:
0.18 g
Carbs:
7.16 g
Water:
92.65 g
Other:
0.01 g
4
3%
3%
11%
81%
Protein:
3.37 g
Fats:
3.29 g
Carbs:
11.2 g
Water:
81.34 g
Other:
0.8 g
Contains
more
Water Water
+13.9%
Contains
more
Protein Protein
+∞%
Contains
more
Fats Fats
+1727.8%
Contains
more
Carbs Carbs
+56.4%
Contains
more
Other Other
+7900%