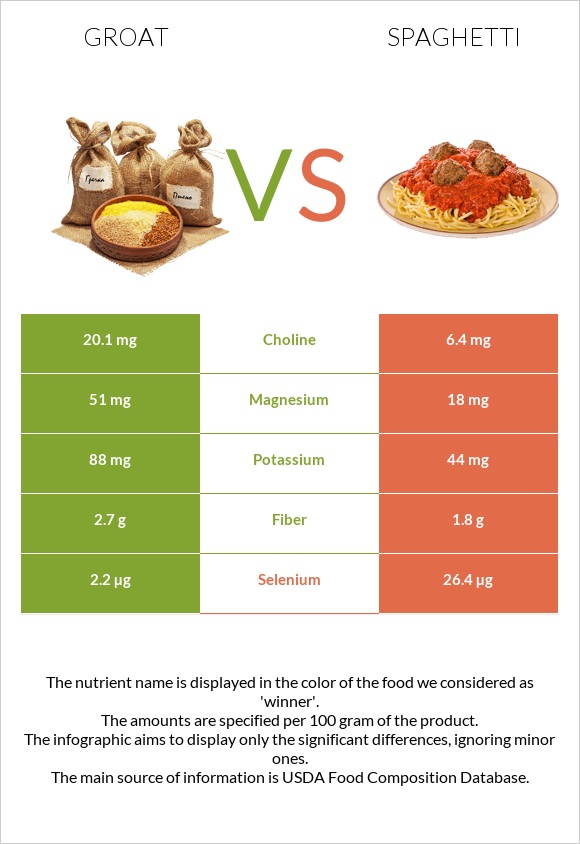
How are groat and spaghetti different? Groat is higher in copper, magnesium, manganese, vitamin B3, phosphorus, fiber, vitamin B2, vitamin B5, and iron; however, spaghetti is richer in selenium. Daily need coverage for copper for groat is 111% higher. Groat contains 21 times more vitamin B2 than spaghetti. While groat contains 0.425mg of vitamin B2, spaghetti contains only 0.02mg. Buckwheat and Pasta, cooked, unenriched, without added salt are the varieties used in this article.
Infographic
Mineral Comparison
Mineral comparison score is based on the number of minerals by which one or the other food is richer. The "coverage" charts below show how much of the daily needs can be covered by 300 grams of the food.
8
100 g
300 g
1 cup - 170g
Magnesium
Magnesium
Calcium
Calcium
Potassium
Potassium
Iron
Iron
Copper
Copper
Zinc
Zinc
Phosphorus
Phosphorus
Sodium
Sodium
Manganese
Manganese
Selenium
Selenium
165%
5.4%
41%
83%
367%
65%
149%
0.13%
170%
45%
1
100 g
300 g
1 cup shells - 105g 1 cup penne - 107g 1 cup rotini - 107g 1 cup farfalle - 107g 1 cup lasagne - 116g 1 cup elbows not packed - 120g 1 cup spaghetti not packed - 124g 1 cup elbows packed - 132g 1 cup spaghetti packed - 151g
Magnesium
Magnesium
Calcium
Calcium
Potassium
Potassium
Iron
Iron
Copper
Copper
Zinc
Zinc
Phosphorus
Phosphorus
Sodium
Sodium
Manganese
Manganese
Selenium
Selenium
13%
2.1%
3.9%
19%
33%
14%
25%
0.13%
42%
144%
Vitamin Comparison
Vitamin comparison score is based on the number of vitamins by which one or the other food is richer. The "coverage" charts below show how much of the daily needs can be covered by 300 grams of the food.
6
100 g
300 g
1 cup - 170g
Vitamin C
Vit. C
Vitamin D
Vit. D
Vitamin A
Vit. A
Vitamin E
Vit. E
Vitamin B1
Vit. B1
Vitamin B2
Vit. B2
Vitamin B3
Vit. B3
Vitamin B5
Vit. B5
Vitamin B6
Vit. B6
Vitamin B12
Vit. B12
Vitamin K
Vit. K
Folate
Folate
0%
0%
0%
0%
25%
98%
132%
74%
48%
0%
0%
23%
1
100 g
300 g
1 cup shells - 105g 1 cup penne - 107g 1 cup rotini - 107g 1 cup farfalle - 107g 1 cup lasagne - 116g 1 cup elbows not packed - 120g 1 cup spaghetti not packed - 124g 1 cup elbows packed - 132g 1 cup spaghetti packed - 151g
Vitamin C
Vit. C
Vitamin D
Vit. D
Vitamin A
Vit. A
Vitamin E
Vit. E
Vitamin B1
Vit. B1
Vitamin B2
Vit. B2
Vitamin B3
Vit. B3
Vitamin B5
Vit. B5
Vitamin B6
Vit. B6
Vitamin B12
Vit. B12
Vitamin K
Vit. K
Folate
Folate
0%
0%
0%
1.2%
5%
4.6%
7.5%
6.7%
11%
0%
0%
5.3%
All nutrients comparison - raw data values
Nutrient
DV% diff.
Copper
1.1mg
0.1mg
111%
Magnesium
231mg
18mg
51%
Manganese
1.3mg
0.322mg
43%
Phosphorus
347mg
58mg
41%
Vitamin B3
7.02mg
0.4mg
41%
Fiber
10g
1.8g
33%
Selenium
8.3µg
26.4µg
33%
Vitamin B2
0.425mg
0.02mg
31%
Vitamin B5
1.233mg
0.112mg
22%
Iron
2.2mg
0.5mg
21%
Zinc
2.4mg
0.51mg
17%
Protein
13.25g
5.8g
15%
Carbs
71.5g
30.86g
14%
Potassium
460mg
44mg
12%
Vitamin B6
0.21mg
0.049mg
12%
Starch
26.01g
11%
Calories
343kcal
158kcal
9%
Vitamin B1
0.101mg
0.02mg
7%
Folate
30µg
7µg
6%
Polyunsaturated fat
1.039g
0.326g
5%
Fats
3.4g
0.93g
4%
Saturated fat
0.741g
0.176g
3%
Monounsaturated fat
1.04g
0.131g
2%
Calcium
18mg
7mg
1%
Choline
6.4mg
1%
Protein per 100 calories
3.9g
3.7g
N/A
Calories per 10 g protein
259kcal
272kcal
N/A
Weight per 100 calories
29g
63g
N/A
Unsaturated / Saturated Fat ratio
2.8
2.6
N/A
Net carbs
61.5g
29.06g
N/A
Sugar
0.56g
N/A
Sodium
1mg
1mg
0%
Vitamin E
0.06mg
0%
Tryptophan
0.192mg
0.083mg
0%
Threonine
0.506mg
0.206mg
0%
Isoleucine
0.498mg
0.228mg
0%
Leucine
0.832mg
0.44mg
0%
Lysine
0.672mg
0.133mg
0%
Methionine
0.172mg
0.065mg
0%
Phenylalanine
0.52mg
0.297mg
0%
Valine
0.678mg
0.262mg
0%
Histidine
0.309mg
0.132mg
0%
Fructose
0.03g
0%
Omega-3 - ALA
0.024g
N/A
Macronutrient Comparison
Macronutrient breakdown side-by-side comparison
4
13%
3%
72%
10%
2%
Protein:
13.25 g
Fats:
3.4 g
Carbs:
71.5 g
Water:
9.75 g
Other:
2.1 g
1
6%
31%
62%
Protein:
5.8 g
Fats:
0.93 g
Carbs:
30.86 g
Water:
62.13 g
Other:
0.28 g
Contains
more
Protein Protein
+128.4%
Contains
more
Fats Fats
+265.6%
Contains
more
Carbs Carbs
+131.7%
Contains
more
Other Other
+650%
Contains
more
Water Water
+537.2%
Fat Type Comparison
Fat type breakdown side-by-side comparison
2
26%
37%
37%
Saturated fat:
Sat. Fat
0.741 g
Monounsaturated fat:
Mono. Fat
1.04 g
Polyunsaturated fat:
Poly. Fat
1.039 g
1
28%
21%
52%
Saturated fat:
Sat. Fat
0.176 g
Monounsaturated fat:
Mono. Fat
0.131 g
Polyunsaturated fat:
Poly. Fat
0.326 g
Contains
more
Mono. Fat Monounsaturated fat
+693.9%
Contains
more
Poly. Fat Polyunsaturated fat
+218.7%
Contains
less
Sat. Fat Saturated fat
-76.2%