Summary of differences between groat and rice Rice has less copper, magnesium, phosphorus, fiber, manganese, vitamin B3, vitamin B2, zinc, vitamin B5, and iron than groat. Groat covers your daily need for copper, 115% more than rice. Groat has 33 times more vitamin B2 than rice. While groat has 0.425mg of vitamin B2, rice has only 0.013mg. These are the specific foods used in this comparison Buckwheat and Rice, white, long-grain, regular, enriched, cooked .
Infographic
Mineral Comparison
Mineral comparison score is based on the number of minerals by which one or the other food is richer. The "coverage" charts below show how much of the daily needs can be covered by 300 grams of the food.
8
100 g
300 g
1 cup - 170g
Magnesium
Magnesium
Calcium
Calcium
Potassium
Potassium
Iron
Iron
Copper
Copper
Zinc
Zinc
Phosphorus
Phosphorus
Sodium
Sodium
Manganese
Manganese
Selenium
Selenium
165%
5.4%
41%
83%
367%
65%
149%
0.13%
170%
45%
0
100 g
300 g
1 cup - 158g
Magnesium
Magnesium
Calcium
Calcium
Potassium
Potassium
Iron
Iron
Copper
Copper
Zinc
Zinc
Phosphorus
Phosphorus
Sodium
Sodium
Manganese
Manganese
Selenium
Selenium
8.6%
3%
3.1%
45%
23%
13%
18%
0.13%
62%
41%
Vitamin Comparison
Vitamin comparison score is based on the number of vitamins by which one or the other food is richer. The "coverage" charts below show how much of the daily needs can be covered by 300 grams of the food.
4
100 g
300 g
1 cup - 170g
Vitamin C
Vit. C
Vitamin D
Vit. D
Vitamin A
Vit. A
Vitamin E
Vit. E
Vitamin B1
Vit. B1
Vitamin B2
Vit. B2
Vitamin B3
Vit. B3
Vitamin B5
Vit. B5
Vitamin B6
Vit. B6
Vitamin B12
Vit. B12
Vitamin K
Vit. K
Folate
Folate
0%
0%
0%
0%
25%
98%
132%
74%
48%
0%
0%
23%
3
100 g
300 g
1 cup - 158g
Vitamin C
Vit. C
Vitamin D
Vit. D
Vitamin A
Vit. A
Vitamin E
Vit. E
Vitamin B1
Vit. B1
Vitamin B2
Vit. B2
Vitamin B3
Vit. B3
Vitamin B5
Vit. B5
Vitamin B6
Vit. B6
Vitamin B12
Vit. B12
Vitamin K
Vit. K
Folate
Folate
0%
0%
0%
0.8%
41%
3%
28%
23%
21%
0%
0%
44%
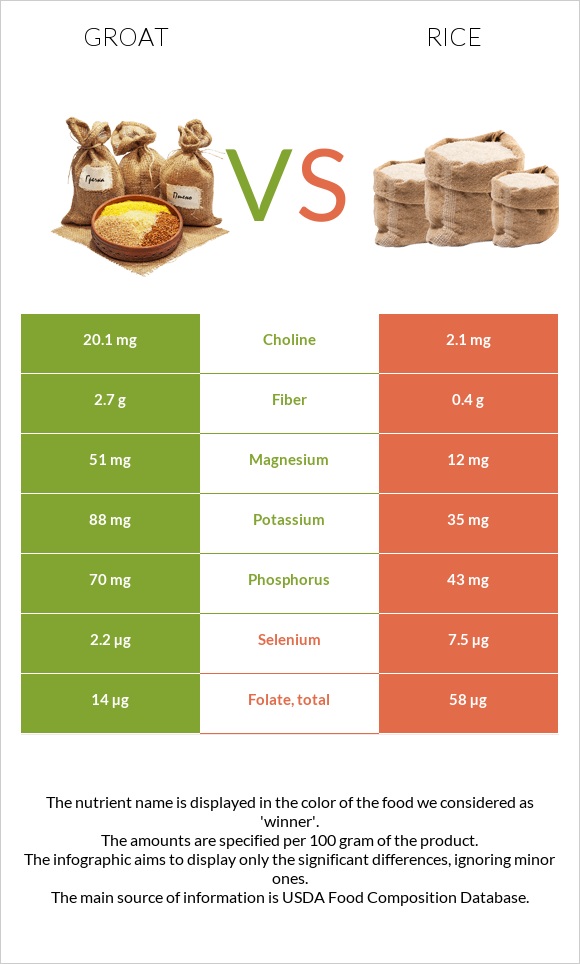
All nutrients comparison - raw data values
Nutrient
DV% diff.
Copper
1.1mg
0.069mg
115%
Magnesium
231mg
12mg
52%
Phosphorus
347mg
43mg
43%
Fiber
10g
0.4g
38%
Manganese
1.3mg
0.472mg
36%
Vitamin B3
7.02mg
1.476mg
35%
Vitamin B2
0.425mg
0.013mg
32%
Protein
13.25g
2.69g
21%
Zinc
2.4mg
0.49mg
17%
Vitamin B5
1.233mg
0.39mg
17%
Carbs
71.5g
28.17g
14%
Potassium
460mg
35mg
13%
Iron
2.2mg
1.2mg
13%
Calories
343kcal
130kcal
11%
Vitamin B6
0.21mg
0.093mg
9%
Folate
30µg
58µg
7%
Polyunsaturated fat
1.039g
0.076g
6%
Fats
3.4g
0.28g
5%
Vitamin B1
0.101mg
0.163mg
5%
Saturated fat
0.741g
0.077g
3%
Monounsaturated fat
1.04g
0.088g
2%
Calcium
18mg
10mg
1%
Selenium
8.3µg
7.5µg
1%
Protein per 100 calories
3.9g
2.1g
N/A
Calories per 10 g protein
259kcal
483kcal
N/A
Weight per 100 calories
29g
77g
N/A
Unsaturated / Saturated Fat ratio
2.8
2.1
N/A
Net carbs
61.5g
27.77g
N/A
Sugar
0.05g
N/A
Sodium
1mg
1mg
0%
Vitamin E
0.04mg
0%
Choline
2.1mg
0%
Tryptophan
0.192mg
0.031mg
0%
Threonine
0.506mg
0.096mg
0%
Isoleucine
0.498mg
0.116mg
0%
Leucine
0.832mg
0.222mg
0%
Lysine
0.672mg
0.097mg
0%
Methionine
0.172mg
0.063mg
0%
Phenylalanine
0.52mg
0.144mg
0%
Valine
0.678mg
0.164mg
0%
Histidine
0.309mg
0.063mg
0%
Macronutrient Comparison
Macronutrient breakdown side-by-side comparison
4
13%
3%
72%
10%
2%
Protein:
13.25 g
Fats:
3.4 g
Carbs:
71.5 g
Water:
9.75 g
Other:
2.1 g
1
3%
28%
68%
Protein:
2.69 g
Fats:
0.28 g
Carbs:
28.17 g
Water:
68.44 g
Other:
0.42 g
Contains
more
Protein Protein
+392.6%
Contains
more
Fats Fats
+1114.3%
Contains
more
Carbs Carbs
+153.8%
Contains
more
Other Other
+400%
Contains
more
Water Water
+601.9%
Fat Type Comparison
Fat type breakdown side-by-side comparison
2
26%
37%
37%
Saturated fat:
Sat. Fat
0.741 g
Monounsaturated fat:
Mono. Fat
1.04 g
Polyunsaturated fat:
Poly. Fat
1.039 g
1
32%
37%
32%
Saturated fat:
Sat. Fat
0.077 g
Monounsaturated fat:
Mono. Fat
0.088 g
Polyunsaturated fat:
Poly. Fat
0.076 g
Contains
more
Mono. Fat Monounsaturated fat
+1081.8%
Contains
more
Poly. Fat Polyunsaturated fat
+1267.1%
Contains
less
Sat. Fat Saturated fat
-89.6%