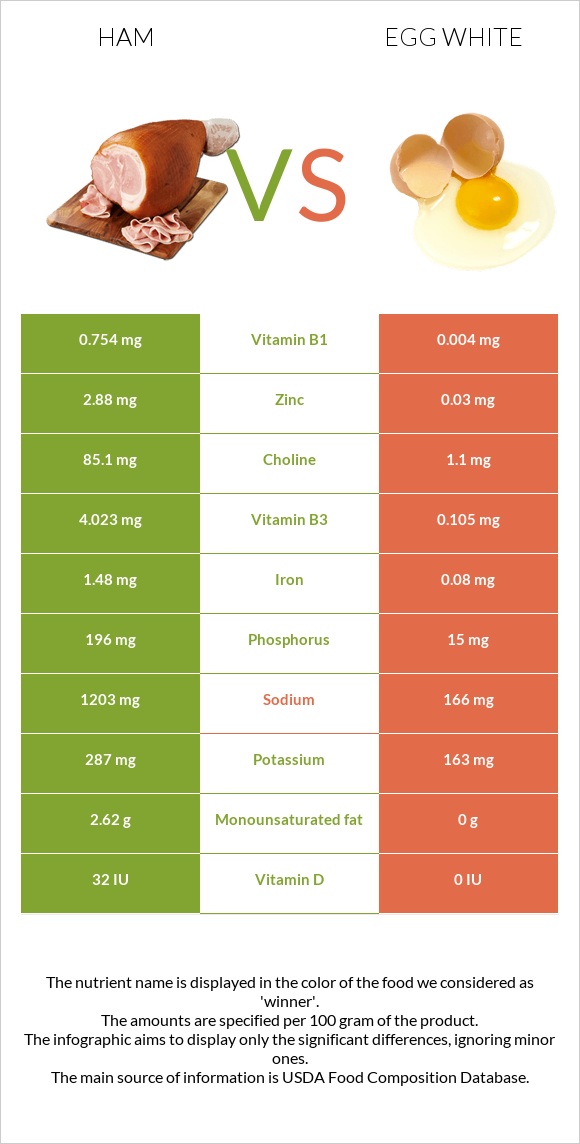
How are ham and egg whites different? Ham is richer in vitamin B1, vitamin B6, zinc, phosphorus, vitamin B3, vitamin B12, and iron, while egg whites are higher in vitamin B2. Ham covers your daily need for vitamin B1, 62% more than egg whites. Pork, cured, ham, boneless, extra lean (approximately 5% fat), roasted and Egg, white, raw, fresh types were used in this article.
Infographic
Mineral Comparison
Mineral comparison score is based on the number of minerals by which one or the other food is richer. The "coverage" charts below show how much of the daily needs can be covered by 300 grams of the food.
8
100 g
300 g
3 oz - 85g 1 cup - 140g
Magnesium
Magnesium
Calcium
Calcium
Potassium
Potassium
Iron
Iron
Copper
Copper
Zinc
Zinc
Phosphorus
Phosphorus
Sodium
Sodium
Manganese
Manganese
Selenium
Selenium
10%
2.4%
25%
56%
26%
79%
84%
157%
7%
106%
1
100 g
300 g
1 large - 33g 1 cup - 243g
Magnesium
Magnesium
Calcium
Calcium
Potassium
Potassium
Iron
Iron
Copper
Copper
Zinc
Zinc
Phosphorus
Phosphorus
Sodium
Sodium
Manganese
Manganese
Selenium
Selenium
7.9%
2.1%
14%
3%
7.7%
0.82%
6.4%
22%
1.4%
109%
Vitamin Comparison
Vitamin comparison score is based on the number of vitamins by which one or the other food is richer. The "coverage" charts below show how much of the daily needs can be covered by 300 grams of the food.
7
100 g
300 g
3 oz - 85g 1 cup - 140g
Vitamin C
Vit. C
Vitamin A
Vit. A
Vitamin E
Vit. E
Vitamin D
Vit. D
Vitamin B1
Vit. B1
Vitamin B2
Vit. B2
Vitamin B3
Vit. B3
Vitamin B5
Vit. B5
Vitamin B6
Vit. B6
Vitamin B12
Vit. B12
Vitamin K
Vit. K
Folate
Folate
0%
0%
5%
12%
189%
47%
75%
24%
92%
81%
0%
2.3%
2
100 g
300 g
1 large - 33g 1 cup - 243g
Vitamin C
Vit. C
Vitamin A
Vit. A
Vitamin E
Vit. E
Vitamin D
Vit. D
Vitamin B1
Vit. B1
Vitamin B2
Vit. B2
Vitamin B3
Vit. B3
Vitamin B5
Vit. B5
Vitamin B6
Vit. B6
Vitamin B12
Vit. B12
Vitamin K
Vit. K
Folate
Folate
0%
0%
0%
0%
1%
101%
2%
11%
1.2%
11%
0%
3%
All nutrients comparison - raw data values
Nutrient
DV% diff.
Vitamin B1
0.754mg
0.004mg
63%
Sodium
1203mg
166mg
45%
Vitamin B6
0.4mg
0.005mg
30%
Zinc
2.88mg
0.03mg
26%
Phosphorus
196mg
15mg
26%
Vitamin B3
4.023mg
0.105mg
24%
Vitamin B12
0.65µg
0.09µg
23%
Protein
20.93g
10.9g
20%
Cholesterol
53mg
0mg
18%
Iron
1.48mg
0.08mg
18%
Vitamin B2
0.202mg
0.439mg
18%
Choline
85.1mg
1.1mg
15%
Fats
5.53g
0.17g
8%
Saturated fat
1.81g
0g
8%
Monounsaturated fat
2.62g
0g
7%
Copper
0.079mg
0.023mg
6%
Calories
145kcal
52kcal
5%
Vitamin D
32 IU
0 IU
4%
Potassium
287mg
163mg
4%
Vitamin D
0.8µg
0µg
4%
Vitamin B5
0.403mg
0.19mg
4%
Polyunsaturated fat
0.54g
0g
4%
Vitamin E
0.25mg
0mg
2%
Manganese
0.054mg
0.011mg
2%
Magnesium
14mg
11mg
1%
Selenium
19.5µg
20µg
1%
Net carbs
1.5g
0.73g
N/A
Carbs
1.5g
0.73g
0%
Calcium
8mg
7mg
0%
Sugar
0g
0.71g
N/A
Folate
3µg
4µg
0%
Tryptophan
0.251mg
0.125mg
0%
Threonine
0.931mg
0.449mg
0%
Isoleucine
0.918mg
0.661mg
0%
Leucine
1.661mg
1.016mg
0%
Lysine
1.775mg
0.806mg
0%
Methionine
0.553mg
0.399mg
0%
Phenylalanine
0.904mg
0.686mg
0%
Valine
0.908mg
0.809mg
0%
Histidine
0.75mg
0.29mg
0%
Fructose
0.07g
0%
Macronutrient Comparison
Macronutrient breakdown side-by-side comparison
4
21%
6%
68%
4%
Protein:
20.93 g
Fats:
5.53 g
Carbs:
1.5 g
Water:
67.67 g
Other:
4.37 g
1
11%
88%
Protein:
10.9 g
Fats:
0.17 g
Carbs:
0.73 g
Water:
87.57 g
Other:
0.63 g
Contains
more
Protein Protein
+92%
Contains
more
Fats Fats
+3152.9%
Contains
more
Carbs Carbs
+105.5%
Contains
more
Other Other
+593.7%
Contains
more
Water Water
+29.4%