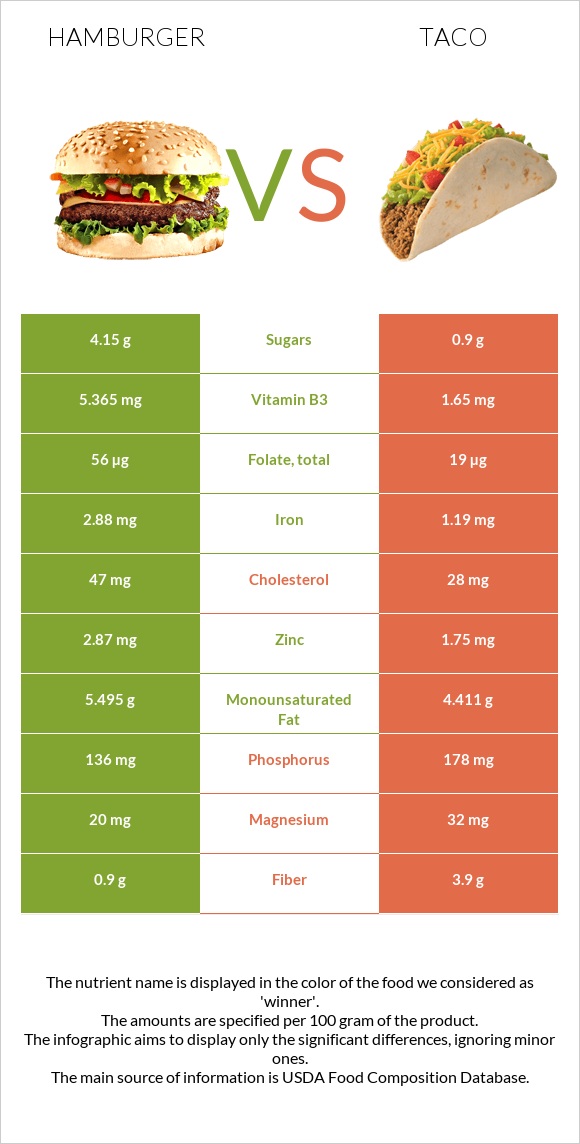
Important differences between hamburgers and taco Hamburgers have more vitamin B3, vitamin B12, iron, vitamin B2, vitamin B1, zinc, folate, and vitamin B6; however, taco is richer in fiber. Hamburgers' daily need coverage for vitamin B3 is 23% more. Hamburgers contain 4 times more vitamin B1 than taco. Hamburgers contain 0.217mg of vitamin B1, while taco contains 0.05mg. Taco contains less cholesterol. Hamburgers have a higher glycemic index. The glycemic index of hamburgers is 66, while the glycemic index of taco is 39. The food varieties used in the comparison are Fast foods, hamburger; double, regular, patty; plain and Fast foods, taco with beef, cheese, and lettuce, hard shell .
Infographic
Mineral Comparison
Mineral comparison score is based on the number of minerals by which one or the other food is richer. The "coverage" charts below show how much of the daily needs can be covered by 300 grams of the food.
4
100 g
300 g
1 item - 120g
Magnesium
Magnesium
Calcium
Calcium
Potassium
Potassium
Iron
Iron
Copper
Copper
Zinc
Zinc
Phosphorus
Phosphorus
Sodium
Sodium
Manganese
Manganese
Selenium
Selenium
14%
31%
20%
108%
30%
78%
58%
54%
28%
0%
4
100 g
300 g
1 each taco - 69g
Magnesium
Magnesium
Calcium
Calcium
Potassium
Potassium
Iron
Iron
Copper
Copper
Zinc
Zinc
Phosphorus
Phosphorus
Sodium
Sodium
Manganese
Manganese
Selenium
Selenium
23%
27%
18%
45%
26%
48%
76%
52%
32%
50%
Vitamin Comparison
Vitamin comparison score is based on the number of vitamins by which one or the other food is richer. The "coverage" charts below show how much of the daily needs can be covered by 300 grams of the food.
7
100 g
300 g
1 item - 120g
Vitamin C
Vit. C
Vitamin D
Vit. D
Vitamin A
Vit. A
Vitamin E
Vit. E
Vitamin B1
Vit. B1
Vitamin B2
Vit. B2
Vitamin B3
Vit. B3
Vitamin B5
Vit. B5
Vitamin B6
Vit. B6
Vitamin B12
Vit. B12
Vitamin K
Vit. K
Folate
Folate
0%
0%
0%
0%
54%
58%
101%
19%
47%
180%
0%
42%
5
100 g
300 g
1 each taco - 69g
Vitamin C
Vit. C
Vitamin D
Vit. D
Vitamin A
Vit. A
Vitamin E
Vit. E
Vitamin B1
Vit. B1
Vitamin B2
Vit. B2
Vitamin B3
Vit. B3
Vitamin B5
Vit. B5
Vitamin B6
Vit. B6
Vitamin B12
Vit. B12
Vitamin K
Vit. K
Folate
Folate
1.3%
1.5%
6.7%
12%
13%
14%
31%
0%
21%
116%
38%
14%
All nutrients comparison - raw data values
Nutrient
DV% diff.
Vitamin B3
5.365mg
1.65mg
23%
Iron
2.88mg
1.19mg
21%
Vitamin B12
1.44µg
0.93µg
21%
Polyunsaturated fat
0.38g
3.042g
18%
Selenium
9.2µg
17%
Protein
17.08g
8.86g
16%
Vitamin B2
0.25mg
0.06mg
15%
Vitamin B1
0.217mg
0.05mg
14%
Vitamin K
15.3µg
13%
Fiber
0.9g
3.9g
12%
Zinc
2.87mg
1.75mg
10%
Vitamin B6
0.203mg
0.09mg
9%
Folate
56µg
19µg
9%
Cholesterol
47mg
28mg
6%
Starch
14.78g
6%
Phosphorus
136mg
178mg
6%
Vitamin B5
0.31mg
6%
Choline
32mg
6%
Vitamin E
0.6mg
4%
Calories
295kcal
226kcal
3%
Fats
14.36g
12.7g
3%
Magnesium
20mg
32mg
3%
Saturated fat
5.096g
4.384g
3%
Monounsaturated fat
5.495g
4.411g
3%
Copper
0.091mg
0.077mg
2%
Vitamin A
0µg
20µg
2%
Fructose
2.03g
0.3g
2%
Carbs
24.1g
19.85g
1%
Vitamin D*
4 IU
1%
Vitamin D
0.1µg
1%
Calcium
102mg
89mg
1%
Potassium
226mg
209mg
1%
Sodium
414mg
397mg
1%
Manganese
0.217mg
0.249mg
1%
Protein per 100 calories
5.8g
3.9g
N/A
Calories per 10 g protein
173kcal
255kcal
N/A
Weight per 100 calories
34g
44g
N/A
Unsaturated / Saturated Fat ratio
1.2
1.7
N/A
Vitamin C
0mg
0.4mg
0%
Net carbs
23.2g
15.95g
N/A
Sugar
4.15g
0.9g
N/A
Trans fat
0.814g
0.467g
N/A
Tryptophan
0.206mg
0%
Threonine
0.666mg
0%
Isoleucine
0.716mg
0%
Leucine
1.319mg
0%
Lysine
1.226mg
0%
Methionine
0.37mg
0%
Phenylalanine
0.677mg
0%
Valine
0.823mg
0%
Histidine
0.505mg
0%
Omega-3 - EPA
0.005g
N/A
Omega-3 - ALA
0.166g
N/A
Omega-3 - DPA
0.006g
N/A
Omega-3 - Eicosatrienoic acid
0.001g
N/A
Omega-6 - Gamma-linoleic acid
0.002g
N/A
Omega-6 - Dihomo-gamma-linoleic acid
0.011g
N/A
Omega-6 - Eicosadienoic acid
0.004g
N/A
Omega-6 - Linoleic acid
2.708g
N/A
Macronutrient Comparison
Macronutrient breakdown side-by-side comparison
4
17%
14%
24%
43%
2%
Protein:
17.08 g
Fats:
14.36 g
Carbs:
24.1 g
Water:
42.67 g
Other:
1.79 g
1
9%
13%
20%
57%
Protein:
8.86 g
Fats:
12.7 g
Carbs:
19.85 g
Water:
57.02 g
Other:
1.57 g
Contains
more
Protein Protein
+92.8%
Contains
more
Fats Fats
+13.1%
Contains
more
Carbs Carbs
+21.4%
Contains
more
Other Other
+14%
Contains
more
Water Water
+33.6%
Fat Type Comparison
Fat type breakdown side-by-side comparison
1
46%
50%
3%
Saturated fat:
Sat. Fat
5.096 g
Monounsaturated fat:
Mono. Fat
5.495 g
Polyunsaturated fat:
Poly. Fat
0.38 g
2
37%
37%
26%
Saturated fat:
Sat. Fat
4.384 g
Monounsaturated fat:
Mono. Fat
4.411 g
Polyunsaturated fat:
Poly. Fat
3.042 g
Contains
more
Mono. Fat Monounsaturated fat
+24.6%
Contains
less
Sat. Fat Saturated fat
-14%
Contains
more
Poly. Fat Polyunsaturated fat
+700.5%
Carbohydrate type comparison
Carbohydrate type breakdown side-by-side comparison
4
5%
28%
49%
3%
14%
Starch:
0 g
Sucrose:
0.22 g
Glucose:
1.16 g
Fructose:
2.03 g
Lactose:
0.13 g
Maltose:
0.6 g
Galactose:
0 g
2
94%
3%
2%
Starch:
14.78 g
Sucrose:
0.4 g
Glucose:
0.2 g
Fructose:
0.3 g
Lactose:
0 g
Maltose:
0 g
Galactose:
0 g
Contains
more
Glucose Glucose
+480%
Contains
more
Fructose Fructose
+576.7%
Contains
more
Lactose Lactose
+∞%
Contains
more
Maltose Maltose
+∞%
Contains
more
Starch Starch
+∞%
Contains
more
Sucrose Sucrose
+81.8%