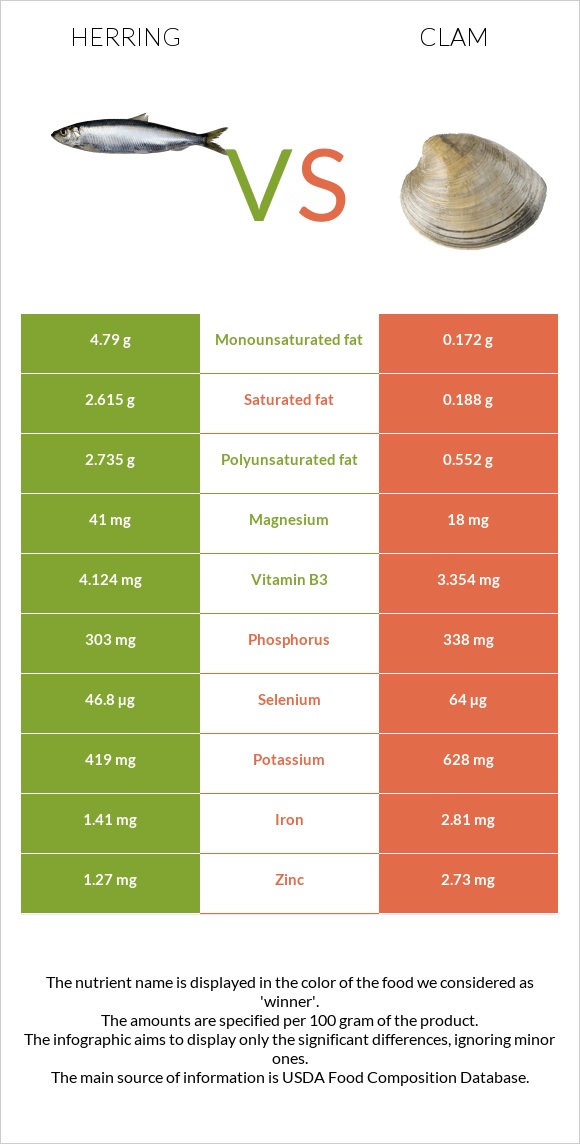
How are herring and clam different? Herring is higher in vitamin B6; however, clam is richer in vitamin B12, copper, manganese, selenium, vitamin C, iron, and zinc. Daily need coverage for vitamin B12 for clam is 3573% higher. Herring contains 14 times more saturated fat than clam. While herring contains 2.615g of saturated fat, clam contains only 0.188g. Herring has a lower glycemic index (0) than clam (27). Fish, herring, Atlantic, cooked, dry heat and Mollusks, clam, mixed species, cooked, moist heat are the varieties used in this article.
Infographic
Mineral Comparison
Mineral comparison score is based on the number of minerals by which one or the other food is richer. The "coverage" charts below show how much of the daily needs can be covered by 300 grams of the food.
2
100 g
300 g
3 oz - 85g 1 fillet - 143g
Magnesium
Magnesium
Calcium
Calcium
Potassium
Potassium
Iron
Iron
Copper
Copper
Zinc
Zinc
Phosphorus
Phosphorus
Sodium
Sodium
Manganese
Manganese
Selenium
Selenium
29%
22%
37%
53%
39%
35%
130%
15%
5.2%
255%
8
100 g
300 g
3 oz - 85g 20 small - 190g
Magnesium
Magnesium
Calcium
Calcium
Potassium
Potassium
Iron
Iron
Copper
Copper
Zinc
Zinc
Phosphorus
Phosphorus
Sodium
Sodium
Manganese
Manganese
Selenium
Selenium
13%
28%
55%
105%
229%
74%
145%
157%
130%
349%
Vitamin Comparison
Vitamin comparison score is based on the number of vitamins by which one or the other food is richer. The "coverage" charts below show how much of the daily needs can be covered by 300 grams of the food.
5
100 g
300 g
3 oz - 85g 1 fillet - 143g
Vitamin C
Vit. C
Vitamin D
Vit. D
Vitamin A
Vit. A
Vitamin E
Vit. E
Vitamin B1
Vit. B1
Vitamin B2
Vit. B2
Vitamin B3
Vit. B3
Vitamin B5
Vit. B5
Vitamin B6
Vit. B6
Vitamin B12
Vit. B12
Vitamin K
Vit. K
Folate
Folate
2.3%
81%
12%
27%
28%
69%
77%
44%
80%
1643%
0.25%
9%
6
100 g
300 g
3 oz - 85g 20 small - 190g
Vitamin C
Vit. C
Vitamin D
Vit. D
Vitamin A
Vit. A
Vitamin E
Vit. E
Vitamin B1
Vit. B1
Vitamin B2
Vit. B2
Vitamin B3
Vit. B3
Vitamin B5
Vit. B5
Vitamin B6
Vit. B6
Vitamin B12
Vit. B12
Vitamin K
Vit. K
Folate
Folate
74%
0%
57%
0%
38%
98%
63%
41%
25%
12361%
0%
22%
All nutrients comparison - raw data values
Nutrient
DV% diff.
Vitamin B12
13.14µg
98.89µg
3573%
Copper
0.118mg
0.688mg
63%
Sodium
115mg
1202mg
47%
Manganese
0.04mg
1mg
42%
Selenium
46.8µg
64µg
31%
Vitamin D*
214 IU
27%
Vitamin D
5.4µg
27%
Vitamin C
0.7mg
22.1mg
24%
Iron
1.41mg
2.81mg
18%
Vitamin B6
0.348mg
0.11mg
18%
Fats
11.59g
1.95g
15%
Vitamin A
36µg
171µg
15%
Choline
83.3mg
15%
Polyunsaturated fat
2.735g
0.552g
15%
Zinc
1.27mg
2.73mg
13%
Monounsaturated fat
4.79g
0.172g
12%
Saturated fat
2.615g
0.188g
11%
Vitamin B2
0.299mg
0.426mg
10%
Vitamin E
1.37mg
9%
Potassium
419mg
628mg
6%
Protein
23.03g
25.55g
5%
Magnesium
41mg
18mg
5%
Phosphorus
303mg
338mg
5%
Vitamin B3
4.124mg
3.354mg
5%
Folate
12µg
29µg
4%
Calories
203kcal
148kcal
3%
Cholesterol
77mg
67mg
3%
Vitamin B1
0.112mg
0.15mg
3%
Carbs
0g
5.13g
2%
Calcium
74mg
92mg
2%
Vitamin B5
0.74mg
0.68mg
1%
Protein per 100 calories
11g
17g
N/A
Calories per 10 g protein
88kcal
58kcal
N/A
Weight per 100 calories
49g
68g
N/A
Unsaturated / Saturated Fat ratio
2.9
3.9
N/A
Net carbs
0g
5.13g
N/A
Vitamin K
0.1µg
0%
Tryptophan
0.258mg
0.286mg
0%
Threonine
1.01mg
1.099mg
0%
Isoleucine
1.061mg
1.112mg
0%
Leucine
1.872mg
1.798mg
0%
Lysine
2.115mg
1.909mg
0%
Methionine
0.682mg
0.576mg
0%
Phenylalanine
0.899mg
0.915mg
0%
Valine
1.187mg
1.116mg
0%
Histidine
0.678mg
0.49mg
0%
Omega-3 - EPA
0.909g
0.138g
N/A
Omega-3 - DHA
1.105g
0.146g
N/A
Omega-3 - DPA
0.071g
0.104g
N/A
Macronutrient Comparison
Macronutrient breakdown side-by-side comparison
2
23%
12%
64%
Protein:
23.03 g
Fats:
11.59 g
Carbs:
0 g
Water:
64.16 g
Other:
1.22 g
3
26%
2%
5%
64%
4%
Protein:
25.55 g
Fats:
1.95 g
Carbs:
5.13 g
Water:
63.64 g
Other:
3.73 g
Contains
more
Fats Fats
+494.4%
Contains
more
Protein Protein
+10.9%
Contains
more
Carbs Carbs
+∞%
Contains
more
Other Other
+205.7%
Fat Type Comparison
Fat type breakdown side-by-side comparison
2
26%
47%
27%
Saturated fat:
Sat. Fat
2.615 g
Monounsaturated fat:
Mono. Fat
4.79 g
Polyunsaturated fat:
Poly. Fat
2.735 g
1
21%
19%
61%
Saturated fat:
Sat. Fat
0.188 g
Monounsaturated fat:
Mono. Fat
0.172 g
Polyunsaturated fat:
Poly. Fat
0.552 g
Contains
more
Mono. Fat Monounsaturated fat
+2684.9%
Contains
more
Poly. Fat Polyunsaturated fat
+395.5%
Contains
less
Sat. Fat Saturated fat
-92.8%