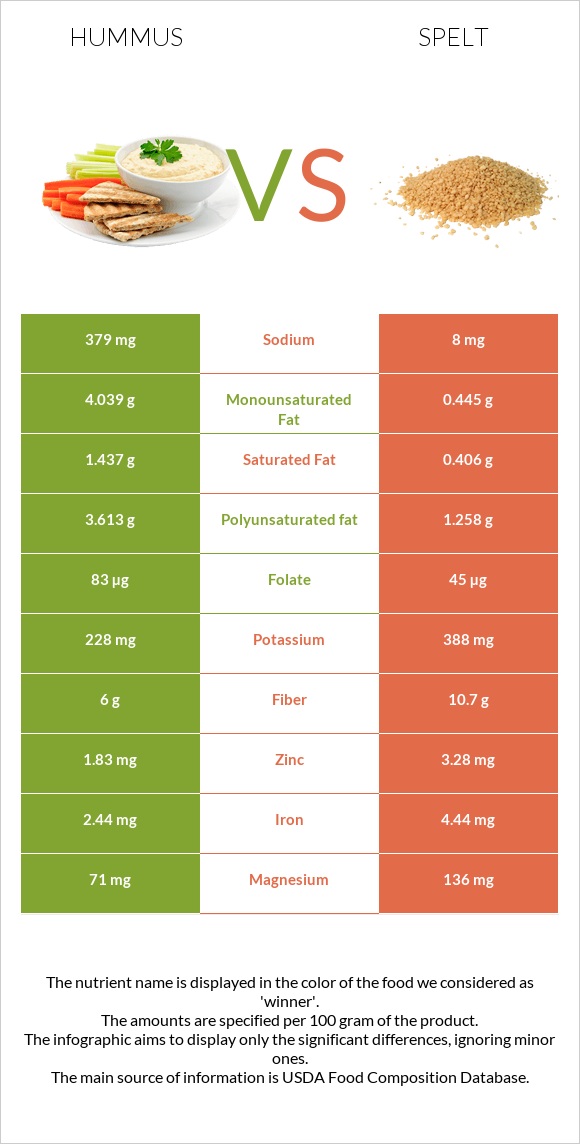
How are hummus and spelt different? Spelt is higher than hummus in manganese, vitamin B3, phosphorus, iron, fiber, vitamin B5, selenium, magnesium, and vitamin B1. Spelt covers your daily need for manganese, 96% more than hummus. Hummus contains 47 times more sodium than spelt. Hummus contains 379mg of sodium, while spelt contains 8mg. Spelt has a higher glycemic index (63) than hummus (6). Hummus, commercial and Spelt, uncooked types were used in this article.
Infographic
Mineral Comparison
Mineral comparison score is based on the number of minerals by which one or the other food is richer. The "coverage" charts below show how much of the daily needs can be covered by 300 grams of the food.
1
100 g
300 g
1 tbsp - 15g 1 cup - 246g
Magnesium
Magnesium
Calcium
Calcium
Potassium
Potassium
Iron
Iron
Copper
Copper
Zinc
Zinc
Phosphorus
Phosphorus
Sodium
Sodium
Manganese
Manganese
Selenium
Selenium
51%
11%
20%
92%
176%
50%
75%
49%
101%
14%
8
100 g
300 g
1 cup - 174g
Magnesium
Magnesium
Calcium
Calcium
Potassium
Potassium
Iron
Iron
Copper
Copper
Zinc
Zinc
Phosphorus
Phosphorus
Sodium
Sodium
Manganese
Manganese
Selenium
Selenium
97%
8.1%
34%
167%
170%
89%
172%
1%
389%
64%
Vitamin Comparison
Vitamin comparison score is based on the number of vitamins by which one or the other food is richer. The "coverage" charts below show how much of the daily needs can be covered by 300 grams of the food.
1
100 g
300 g
1 tbsp - 15g 1 cup - 246g
Vitamin C
Vit. C
Vitamin D
Vit. D
Vitamin A
Vit. A
Vitamin E
Vit. E
Vitamin B1
Vit. B1
Vitamin B2
Vit. B2
Vitamin B3
Vit. B3
Vitamin B5
Vit. B5
Vitamin B6
Vit. B6
Vitamin B12
Vit. B12
Vitamin K
Vit. K
Folate
Folate
0%
0%
0%
0%
45%
15%
11%
7.9%
46%
0%
0%
62%
7
100 g
300 g
1 cup - 174g
Vitamin C
Vit. C
Vitamin D
Vit. D
Vitamin A
Vit. A
Vitamin E
Vit. E
Vitamin B1
Vit. B1
Vitamin B2
Vit. B2
Vitamin B3
Vit. B3
Vitamin B5
Vit. B5
Vitamin B6
Vit. B6
Vitamin B12
Vit. B12
Vitamin K
Vit. K
Folate
Folate
0%
0%
0%
16%
91%
26%
128%
64%
53%
0%
9%
34%
All nutrients comparison - raw data values
Nutrient
DV% diff.
Manganese
0.773mg
2.983mg
96%
Vitamin B3
0.582mg
6.843mg
39%
Phosphorus
176mg
401mg
32%
Iron
2.44mg
4.44mg
25%
Starch
53.92g
22%
Carbs
14.29g
70.19g
19%
Fiber
6g
10.7g
19%
Vitamin B5
0.132mg
1.068mg
19%
Selenium
2.6µg
11.7µg
17%
Sodium
379mg
8mg
16%
Polyunsaturated fat
3.613g
1.258g
16%
Magnesium
71mg
136mg
15%
Vitamin B1
0.18mg
0.364mg
15%
Protein
7.9g
14.57g
13%
Zinc
1.83mg
3.28mg
13%
Fats
9.6g
2.43g
11%
Folate
83µg
45µg
10%
Calories
166kcal
338kcal
9%
Monounsaturated fat
4.039g
0.445g
9%
Potassium
228mg
388mg
5%
Vitamin E
0.79mg
5%
Saturated fat
1.437g
0.406g
5%
Vitamin B2
0.064mg
0.113mg
4%
Vitamin K
3.6µg
3%
Copper
0.527mg
0.511mg
2%
Vitamin B6
0.2mg
0.23mg
2%
Calcium
38mg
27mg
1%
Protein per 100 calories
4.8g
4.3g
N/A
Calories per 10 g protein
210kcal
232kcal
N/A
Weight per 100 calories
60g
30g
N/A
Unsaturated / Saturated Fat ratio
5.3
4.2
N/A
Net carbs
8.29g
59.49g
N/A
Sugar
6.82g
N/A
Tryptophan
0.132mg
0%
Threonine
0.443mg
0%
Isoleucine
0.552mg
0%
Leucine
1.07mg
0%
Lysine
0.409mg
0%
Methionine
0.258mg
0%
Phenylalanine
0.737mg
0%
Valine
0.681mg
0%
Histidine
0.36mg
0%
Fructose
0.24g
0%
Omega-3 - ALA
0.065g
N/A
Macronutrient Comparison
Macronutrient breakdown side-by-side comparison
2
8%
10%
14%
67%
Protein:
7.9 g
Fats:
9.6 g
Carbs:
14.29 g
Water:
66.59 g
Other:
1.62 g
3
15%
2%
70%
11%
2%
Protein:
14.57 g
Fats:
2.43 g
Carbs:
70.19 g
Water:
11.02 g
Other:
1.79 g
Contains
more
Fats Fats
+295.1%
Contains
more
Water Water
+504.3%
Contains
more
Protein Protein
+84.4%
Contains
more
Carbs Carbs
+391.2%
Contains
more
Other Other
+10.5%
Fat Type Comparison
Fat type breakdown side-by-side comparison
2
16%
44%
40%
Saturated fat:
Sat. Fat
1.437 g
Monounsaturated fat:
Mono. Fat
4.039 g
Polyunsaturated fat:
Poly. Fat
3.613 g
1
19%
21%
60%
Saturated fat:
Sat. Fat
0.406 g
Monounsaturated fat:
Mono. Fat
0.445 g
Polyunsaturated fat:
Poly. Fat
1.258 g
Contains
more
Mono. Fat Monounsaturated fat
+807.6%
Contains
more
Poly. Fat Polyunsaturated fat
+187.2%
Contains
less
Sat. Fat Saturated fat
-71.7%