Significant differences between lablab and bean raw The amount of folate, copper, selenium, phosphorus, vitamin B1, vitamin B6, potassium, manganese, magnesium, and vitamin B2 in bean raw is higher than in lablab. Bean raw covers your daily folate needs 130% more than lablab. Lablab has a higher glycemic index. The glycemic index of lablab is 45, while the glycemic index of bean raw is 33. Specific food types used in this comparison are Hyacinth beans, mature seeds, cooked, boiled, without salt and Beans, pinto, mature seeds, raw .
Infographic
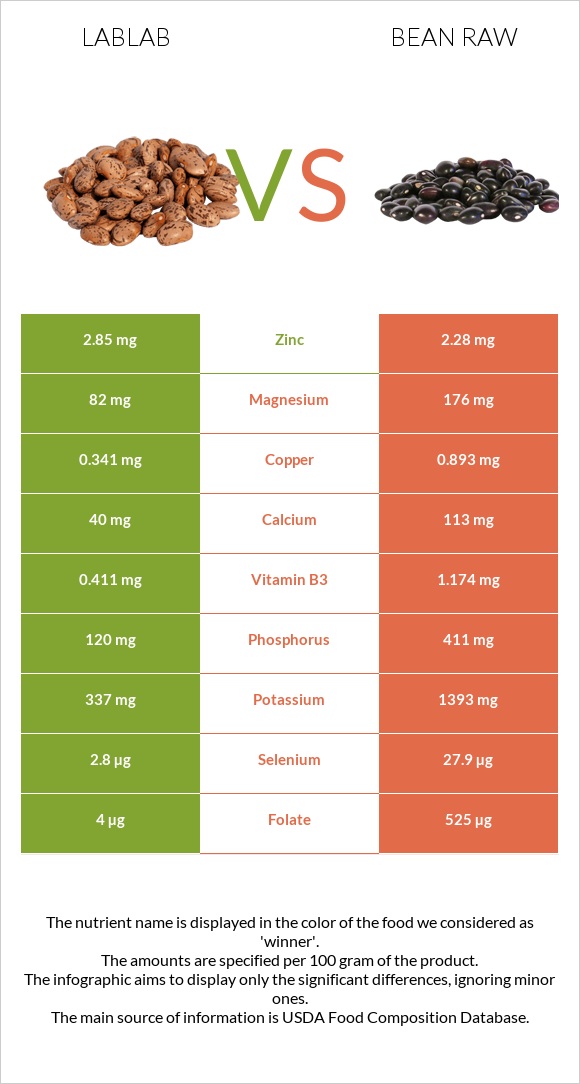
Mineral Comparison
Mineral comparison score is based on the number of minerals by which one or the other food is richer. The "coverage" charts below show how much of the daily needs can be covered by 300 grams of the food.
2
100 g
300 g
1 cup - 194g
Magnesium
Magnesium
Calcium
Calcium
Potassium
Potassium
Iron
Iron
Copper
Copper
Zinc
Zinc
Phosphorus
Phosphorus
Sodium
Sodium
Manganese
Manganese
Selenium
Selenium
59%
12%
30%
172%
114%
78%
51%
0.91%
63%
15%
8
100 g
300 g
1 tbsp - 12g 1 cup - 193g
Magnesium
Magnesium
Calcium
Calcium
Potassium
Potassium
Iron
Iron
Copper
Copper
Zinc
Zinc
Phosphorus
Phosphorus
Sodium
Sodium
Manganese
Manganese
Selenium
Selenium
126%
34%
123%
190%
298%
62%
176%
1.6%
150%
152%
Vitamin Comparison
Vitamin comparison score is based on the number of vitamins by which one or the other food is richer. The "coverage" charts below show how much of the daily needs can be covered by 300 grams of the food.
0
100 g
300 g
1 cup - 194g
Vitamin C
Vit. C
Vitamin D
Vit. D
Vitamin A
Vit. A
Vitamin E
Vit. E
Vitamin B1
Vit. B1
Vitamin B2
Vit. B2
Vitamin B3
Vit. B3
Vitamin B5
Vit. B5
Vitamin B6
Vit. B6
Vitamin B12
Vit. B12
Vitamin K
Vit. K
Folate
Folate
0%
0%
0%
0%
68%
8.5%
7.7%
19%
8.5%
0%
0%
3%
9
100 g
300 g
1 tbsp - 12g 1 cup - 193g
Vitamin C
Vit. C
Vitamin D
Vit. D
Vitamin A
Vit. A
Vitamin E
Vit. E
Vitamin B1
Vit. B1
Vitamin B2
Vit. B2
Vitamin B3
Vit. B3
Vitamin B5
Vit. B5
Vitamin B6
Vit. B6
Vitamin B12
Vit. B12
Vitamin K
Vit. K
Folate
Folate
21%
0%
0%
4.2%
178%
49%
22%
47%
109%
0%
14%
394%
All nutrients comparison - raw data values
Nutrient
DV% diff.
Folate
4µg
525µg
130%
Fiber
15.5g
62%
Copper
0.341mg
0.893mg
61%
Selenium
2.8µg
27.9µg
46%
Phosphorus
120mg
411mg
42%
Vitamin B1
0.27mg
0.713mg
37%
Vitamin B6
0.037mg
0.474mg
34%
Potassium
337mg
1393mg
31%
Manganese
0.482mg
1.148mg
29%
Protein
8.14g
21.42g
27%
Magnesium
82mg
176mg
22%
Carbs
20.69g
62.55g
14%
Starch
34.17g
14%
Vitamin B2
0.037mg
0.212mg
13%
Calories
117kcal
347kcal
12%
Choline
66.2mg
12%
Vitamin B5
0.316mg
0.785mg
9%
Vitamin C
0mg
6.3mg
7%
Calcium
40mg
113mg
7%
Iron
4.58mg
5.07mg
6%
Zinc
2.85mg
2.28mg
5%
Vitamin B3
0.411mg
1.174mg
5%
Vitamin K
5.6µg
5%
Fats
0.58g
1.23g
1%
Vitamin E
0.21mg
1%
Saturated fat
0.099g
0.235g
1%
Monounsaturated fat
0.026g
0.229g
1%
Polyunsaturated fat
0.245g
0.407g
1%
Protein per 100 calories
7g
6.2g
N/A
Calories per 10 g protein
144kcal
162kcal
N/A
Weight per 100 calories
85g
29g
N/A
Net carbs
20.69g
47.05g
N/A
Sugar
2.11g
N/A
Sodium
7mg
12mg
0%
Tryptophan
0.068mg
0.237mg
0%
Threonine
0.315mg
0.81mg
0%
Isoleucine
0.39mg
0.871mg
0%
Leucine
0.691mg
1.558mg
0%
Lysine
0.556mg
1.356mg
0%
Methionine
0.065mg
0.259mg
0%
Phenylalanine
0.41mg
1.095mg
0%
Valine
0.422mg
0.998mg
0%
Histidine
0.233mg
0.556mg
0%
Macronutrient Comparison
Macronutrient breakdown side-by-side comparison
1
8%
21%
69%
Protein:
8.14 g
Fats:
0.58 g
Carbs:
20.69 g
Water:
69.13 g
Other:
1.46 g
4
21%
63%
11%
3%
Protein:
21.42 g
Fats:
1.23 g
Carbs:
62.55 g
Water:
11.33 g
Other:
3.47 g
Contains
more
Water Water
+510.2%
Contains
more
Protein Protein
+163.1%
Contains
more
Fats Fats
+112.1%
Contains
more
Carbs Carbs
+202.3%
Contains
more
Other Other
+137.7%
Fat Type Comparison
Fat type breakdown side-by-side comparison
1
27%
7%
66%
Saturated fat:
Sat. Fat
0.099 g
Monounsaturated fat:
Mono. Fat
0.026 g
Polyunsaturated fat:
Poly. Fat
0.245 g
2
27%
26%
47%
Saturated fat:
Sat. Fat
0.235 g
Monounsaturated fat:
Mono. Fat
0.229 g
Polyunsaturated fat:
Poly. Fat
0.407 g
Contains
less
Sat. Fat Saturated fat
-57.9%
Contains
more
Mono. Fat Monounsaturated fat
+780.8%
Contains
more
Poly. Fat Polyunsaturated fat
+66.1%