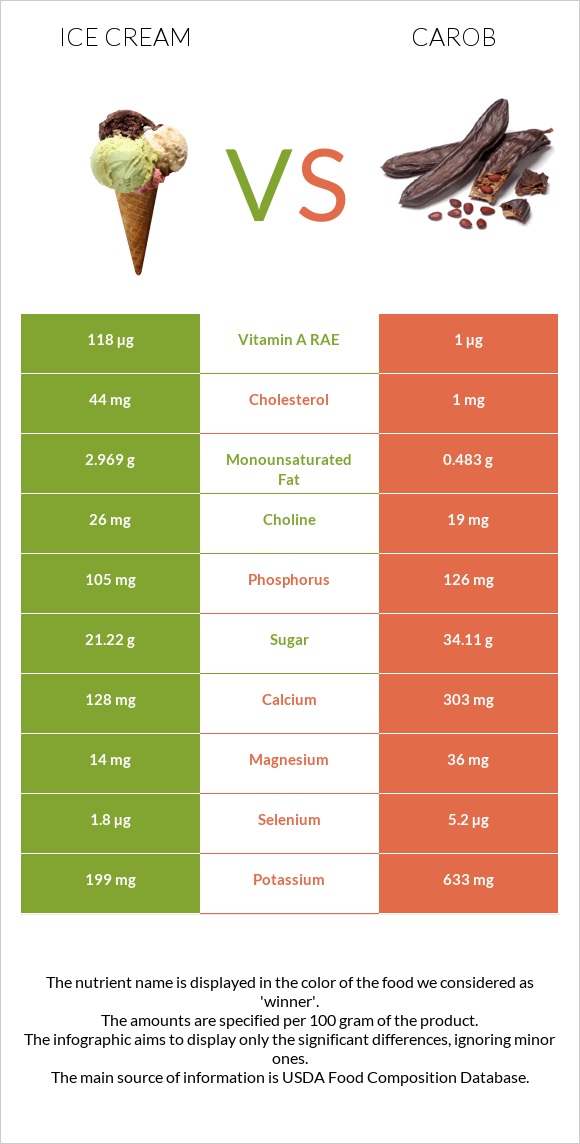
What are the main differences between ice cream and carob? Ice cream is richer in vitamin A, yet carob is richer in zinc, copper, calcium, iron, potassium, fiber, and vitamin E. Carob's daily need coverage for saturated fat is 111% higher. Ice cream has 44 times more cholesterol than carob. Ice cream has 44mg of cholesterol, while carob has 1mg. Carob has a lower glycemic index than ice cream. We used Ice creams, vanilla and Candies, carob, unsweetened types in this comparison.
Infographic
Mineral Comparison
Mineral comparison score is based on the number of minerals by which one or the other food is richer. The "coverage" charts below show how much of the daily needs can be covered by 300 grams of the food.
1
100 g
300 g
1 serving 1/2 cup - 66g
Magnesium
Magnesium
Calcium
Calcium
Potassium
Potassium
Iron
Iron
Copper
Copper
Zinc
Zinc
Phosphorus
Phosphorus
Sodium
Sodium
Manganese
Manganese
Selenium
Selenium
10%
38%
18%
3.4%
7.7%
19%
45%
10%
1%
9.8%
9
100 g
300 g
1 oz - 28.35g 1 bar (3 oz) - 87g
Magnesium
Magnesium
Calcium
Calcium
Potassium
Potassium
Iron
Iron
Copper
Copper
Zinc
Zinc
Phosphorus
Phosphorus
Sodium
Sodium
Manganese
Manganese
Selenium
Selenium
26%
91%
56%
48%
61%
96%
54%
14%
18%
28%
Vitamin Comparison
Vitamin comparison score is based on the number of vitamins by which one or the other food is richer. The "coverage" charts below show how much of the daily needs can be covered by 300 grams of the food.
5
100 g
300 g
1 serving 1/2 cup - 66g
Vitamin C
Vit. C
Vitamin D
Vit. D
Vitamin A
Vit. A
Vitamin E
Vit. E
Vitamin B1
Vit. B1
Vitamin B2
Vit. B2
Vitamin B3
Vit. B3
Vitamin B5
Vit. B5
Vitamin B6
Vit. B6
Vitamin B12
Vit. B12
Vitamin K
Vit. K
Folate
Folate
2%
3%
39%
6%
10%
55%
2.2%
35%
11%
49%
0.75%
3.8%
7
100 g
300 g
1 oz - 28.35g 1 bar (3 oz) - 87g
Vitamin C
Vit. C
Vitamin D
Vit. D
Vitamin A
Vit. A
Vitamin E
Vit. E
Vitamin B1
Vit. B1
Vitamin B2
Vit. B2
Vitamin B3
Vit. B3
Vitamin B5
Vit. B5
Vitamin B6
Vit. B6
Vitamin B12
Vit. B12
Vitamin K
Vit. K
Folate
Folate
1.7%
0%
0.33%
31%
25%
41%
20%
45%
30%
35%
19%
16%
All nutrients comparison - raw data values
Nutrient
DV% diff.
Saturated fat
6.79g
29.018g
101%
Fats
11g
31.36g
31%
Zinc
0.69mg
3.53mg
26%
Calcium
128mg
303mg
18%
Copper
0.023mg
0.183mg
18%
Calories
207kcal
540kcal
17%
Iron
0.09mg
1.29mg
15%
Cholesterol
44mg
1mg
14%
Potassium
199mg
633mg
13%
Vitamin A
118µg
1µg
13%
Fiber
0.7g
3.8g
12%
Carbs
23.6g
56.29g
11%
Protein
3.5g
8.15g
9%
Vitamin E
0.3mg
1.57mg
8%
Manganese
0.008mg
0.14mg
6%
Selenium
1.8µg
5.2µg
6%
Vitamin B3
0.116mg
1.04mg
6%
Vitamin B6
0.048mg
0.13mg
6%
Vitamin K
0.3µg
7.7µg
6%
Monounsaturated fat
2.969g
0.483g
6%
Magnesium
14mg
36mg
5%
Vitamin B1
0.041mg
0.1mg
5%
Vitamin B2
0.24mg
0.178mg
5%
Vitamin B12
0.39µg
0.28µg
5%
Folate
5µg
21µg
4%
Phosphorus
105mg
126mg
3%
Vitamin B5
0.581mg
0.75mg
3%
Vitamin D*
8 IU
0 IU
1%
Vitamin D
0.2µg
0µg
1%
Sodium
80mg
107mg
1%
Choline
26mg
19mg
1%
Polyunsaturated fat
0.452g
0.295g
1%
Protein per 100 calories
1.7g
1.5g
N/A
Calories per 10 g protein
591kcal
663kcal
N/A
Weight per 100 calories
48g
19g
N/A
Unsaturated / Saturated Fat ratio
0.5
0.03
N/A
Vitamin C
0.6mg
0.5mg
0%
Net carbs
22.9g
52.49g
N/A
Sugar
21.22g
34.11g
N/A
Tryptophan
0.045mg
0%
Threonine
0.146mg
0%
Isoleucine
0.195mg
0%
Leucine
0.316mg
0%
Lysine
0.258mg
0%
Methionine
0.081mg
0%
Phenylalanine
0.157mg
0%
Valine
0.217mg
0%
Histidine
0.088mg
0%
Omega-3 - EPA
0.003g
0g
N/A
Macronutrient Comparison
Macronutrient breakdown side-by-side comparison
1
4%
11%
24%
61%
Protein:
3.5 g
Fats:
11 g
Carbs:
23.6 g
Water:
61 g
Other:
0.9 g
4
8%
31%
56%
3%
Protein:
8.15 g
Fats:
31.36 g
Carbs:
56.29 g
Water:
1.54 g
Other:
2.66 g
Contains
more
Water Water
+3861%
Contains
more
Protein Protein
+132.9%
Contains
more
Fats Fats
+185.1%
Contains
more
Carbs Carbs
+138.5%
Contains
more
Other Other
+195.6%
Fat Type Comparison
Fat type breakdown side-by-side comparison
3
66%
29%
4%
Saturated fat:
Sat. Fat
6.79 g
Monounsaturated fat:
Mono. Fat
2.969 g
Polyunsaturated fat:
Poly. Fat
0.452 g
0
97%
Saturated fat:
Sat. Fat
29.018 g
Monounsaturated fat:
Mono. Fat
0.483 g
Polyunsaturated fat:
Poly. Fat
0.295 g
Contains
less
Sat. Fat Saturated fat
-76.6%
Contains
more
Mono. Fat Monounsaturated fat
+514.7%
Contains
more
Poly. Fat Polyunsaturated fat
+53.2%