Ice Cream vs. Sherbet — Health Impact and Nutrition Comparison


Summary
Ice cream has slightly lower sugar and carbohydrate content compared to sherbet, but also higher amounts of fats. On the other hand, one serving of sherbet provides around 50 less calories than ice cream. Although the glycemic indexes of both ice cream and sherbet fall at the medium range, ice cream has a higher glycemic index value.
Whereas sherbet is composed of fruit puree and added sugars, ice cream is based mostly on dairy. A single serving of neither ice cream nor sherbet contains significantly high amounts of any of the vitamins or minerals. However, ice cream does contain adequate amounts of certain vitamins such as vitamin B12, vitamin B5, and vitamin B2.
Introduction
Ice cream is a popular semi-frozen food. Its main ingredients are sugar, cream, flavoring, and milk. Given its composition, ice cream is considered a dairy product because it is mainly made with milk, cream, or butterfat.
We can make ice cream full fat, low fat or reduced fat, and light fat. The fat content of milk in ice cream ranges from 10 to 15%. Light fat ice cream is the one with the lowest composition of milk fat at 5%.
Ice cream can have creamy flavors, like vanilla, chocolate, cookie, etc. In addition, it can be fruity or sweet, like melon, banana, bubble gum, etc.
Sherbet (sometimes also known as ‘sherbert’) is a frozen dessert made from fruit puree, sugar, and very low milk fat, 1-2%. It is a sorbet with added milk fat. Stabilizing elements can be added into sherbets, like vegetable gum, egg yolk, etc.; these stabilizing elements enhance the texture of the sherbet.
Based on these above-mentioned recipes, ice cream and sherbet cannot be part of the lactose-free or vegan diets because of the dairy products used in their production. Depending on the recipes, both ice cream and sherbet may be made vegan or dairy-free if certain dairy substitutes are used.
Varieties
Both of these frozen treats have a wide range of flavors and taste. Thus, the nutrients may vary accordingly.
A vanilla ice cream has different sugar and fat content compared to brownie or cookie ice cream.
Similarly, sherbets with different flavors like lemon or fruit flavors such as raspberry, pineapple, and orange have different vitamin and mineral content differences. These changes do not necessarily mean a drastic change in the vitamin and mineral contents; however, we must consider the variation.
A famous party beverage is the sherbet punch. The sherbet punch is made with different fruit juices or lime soda (7up). You should consider the sugar content in the sherbet punch, as it tends to be higher than in a regular sherbet.
Another difference between sherbet and ice cream is found in their methods of production. Additives are usually used during the production, which may be harmful to the body and gut microbiomes. It is recommended to avoid ice creams and sherbets that have additives in them.
Nutritional Content Comparison
The recommended serving sizes for both ice cream and sherbet have recently been increased from ½ of a cup to ⅔ of a cup (1). This is an equivalent of around 85-120g.
This recent change has been made to make the serving sizes closer to what people actually consume in their scoop of an ice cream or sherbet.
In this section, we will compare the nutritional composition of vanilla ice cream and orange sherbet per 100-gram serving.
Macronutrients and Calories
As can be seen from the graphs below, the macronutrient composition of ice cream and sherbet are quite similar, with few differences, especially in the fats and protein distributions.
Macronutrient Comparison
Contains
more
ProteinProtein
+218.2%
Contains
more
FatsFats
+450%
Contains
more
OtherOther
+125%
Contains
more
CarbsCarbs
+28.8%
Calories
For the same amount of serving, orange sherbet provides lower calories when compared to vanilla ice cream.
Sherbet has 144 calories per 100g, while ice cream has 207 calories.
Fats
Ice cream contains more fat than sherbet. Per 100-gram serving, the amount of fats in ice cream is 11 grams, while only 2 grams in sherbet.
However, if we look at the fat distribution graphs below, we can notice that ice cream and sherbet have similar fat type distribution. Since ice cream has more total fats, it follows that ice cream also has more saturated fat, polyunsaturated fat, monounsaturated fat, and cholesterol.
Fat Type Comparison
Contains
more
Mono. FatMonounsaturated fat
+460.2%
Contains
more
Poly. FatPolyunsaturated fat
+465%
Contains
less
Sat. FatSaturated fat
-82.9%
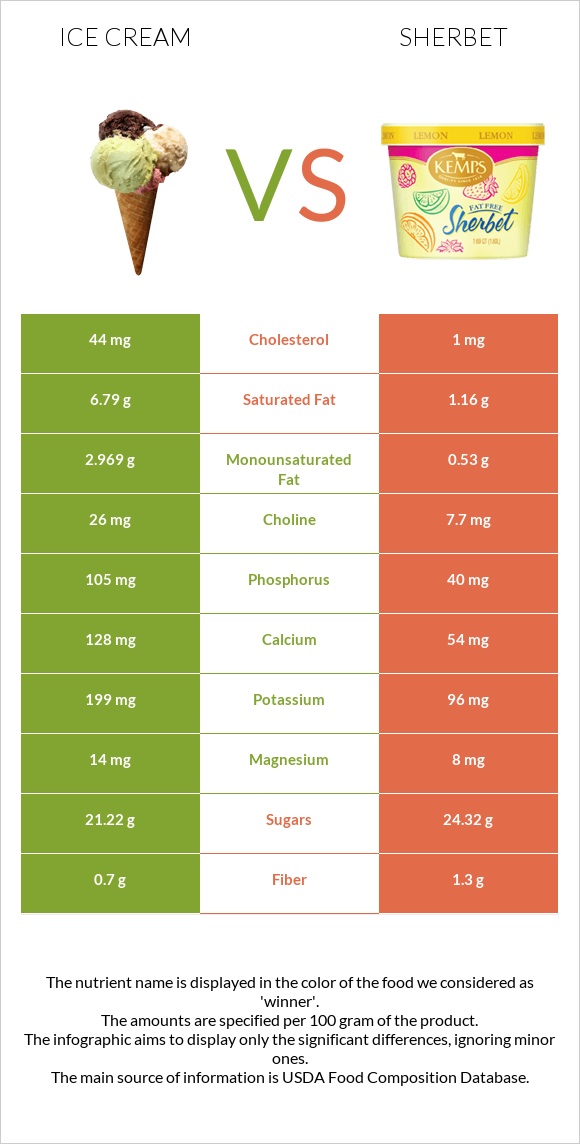
Ice cream contains 6.79g of saturated fat compared to sherbet, which contains 1.16g. The daily recommended value of saturated fat is less than 20g.
The monounsaturated fat content of ice cream is 2.9g, whereas sherbet contains 0.53g.
The cholesterol content of ice cream is 44mg, while sherbet contains far less cholesterol – 1mg, nearly considered negligible.
Hence, sherbet is lower in fat and cholesterol content compared to ice cream.
Protein
Ice cream contains higher amounts of proteins than sherbet due to the dairy content of ice cream. Per 100-gram serving, ice cream has 3.5g of protein, while sherbet has 1.1g.
Carbohydrates
When it comes to carbohydrates, sherbet contains higher carbs (30.4g per 100g) than ice cream (23.6g per 100g). This is because sherbet is composed of fruit puree and added sugar while ice cream is based on dairy.
Vitamin Content Comparison
A single serving of neither ice cream nor sherbet contains significant amounts of any of the vitamins. However, ice cream does contain adequate amounts of certain vitamins such as vitamin B12, vitamin B5, and vitamin B2, while sherbet contains little amounts of some vitamins such as vitamin B12, vitamin C, vitamin B5, and vitamin B2.
The vitamin C content in sherbet is 2.3mg and for ice cream it is equal to 0.6mg. The daily requirement for vitamin C is 65-90mg, which means that although sherbet is richer in vitamin C, they both have minimal input into the daily need.
This is also the case for vitamin A and vitamin B2, which are present more in ice cream than sherbet but still are not significant enough when put in the context of daily need. Ice cream contains 126mcg of vitamin A, but the daily requirement for vitamin A for males is 900mcg, and for females is 700mcg. For vitamin B2, the amount in ice cream is 0.24mg, with the daily requirement of the vitamin being 1.3mg in males and 1.1mg in females.
Vitamin Comparison
Contains
more
Vitamin DVitamin D
+∞%
Contains
more
Vitamin AVitamin A
+883.3%
Contains
more
Vitamin EVitamin E
+2900%
Contains
more
Vitamin B1Vitamin B1
+51.9%
Contains
more
Vitamin B2Vitamin B2
+147.4%
Contains
more
Vitamin B3Vitamin B3
+84.1%
Contains
more
Vitamin B5Vitamin B5
+159.4%
Contains
more
Vitamin B6Vitamin B6
+108.7%
Contains
more
Vitamin B12Vitamin B12
+200%
Contains
more
Vitamin KVitamin K
+∞%
Contains
more
FolateFolate
+25%
Contains
more
Vitamin CVitamin C
+283.3%
Mineral Content Comparison
Sherbet and ice cream have similar mineral profiles; however, their distribution is different:
- Calcium: sherbet contains 54mg, while ice cream contains 128mg. The daily requirement is 1000mg a day.
- Sodium: sherbet contains 46mg, while ice cream contains 80mg.
- Zinc: sherbet contains 0.48mg and ice cream 0.69mg. The daily requirement is 8mg for women and 11mg for men.
Ice cream also contains 200mg of potassium and 105mg of phosphorus.
As seen in the data above, the mineral profile of sherbet and ice cream is similar when content is discussed. However, the amounts are 2-2.5x higher for ice cream. Keep in mind that again, a single serving of neither ice cream nor sherbet provides enough minerals to fill up the daily need.
Mineral Comparison
Contains
more
MagnesiumMagnesium
+75%
Contains
more
CalciumCalcium
+137%
Contains
more
PotassiumPotassium
+107.3%
Contains
more
ZincZinc
+43.8%
Contains
more
PhosphorusPhosphorus
+162.5%
Contains
more
SeleniumSelenium
+20%
Contains
more
IronIron
+55.6%
Contains
more
CopperCopper
+21.7%
Contains
less
SodiumSodium
-42.5%
Contains
more
ManganeseManganese
+37.5%
Glycemic Index
The glycemic index is a rating system used for foods containing carbohydrates.
The glycemic index of sherbet is lower than the glycemic index of ice cream.
Sherbet has a glycemic index of 51, while the glycemic index for ice cream is 62. Both are considered medium glycemic index foods.
Acidity
One way to understand the acidity of foods is through their potential renal acid load (PRAL) value, which shows how much acid or base the given food produces inside the organism.
Based on our calculations, the PRAL values of ice cream and sherbet are -0.6 and -0.9, respectively, which means both are alkaline-forming.
Health Impact
Ice cream contains probiotic characteristics that influence the gut bacteria, the normal flora (2).
Moreover, it has been studied that ice cream having a glycemic index above the low threshold (medium levels) contributes to developing acne in teenagers (3). Ice cream intake should be moderated to prevent acne.
Cardiovascular Health
Eating ice cream and desserts can cause metabolic syndrome, which directly leads to high blood pressure, high cholesterol, and obesity. This significantly increases cardiovascular risk (the risk of myocardial infarction, stroke, and death from cardiovascular disease).
Sherbet is a healthier alternative to ice cream as it contains less fat, making it a perfect choice for health-conscious people (4).
Limit your saturated fat intake to 5-6% of your daily calorie intake, as recommended by the American Heart Association. For example, if you consume 2,000 calories per day, do not consume more than 13 grams of saturated fat per day (5).
Ice cream or Sherbet? The Best Choice for Diabetics
Sherbet is sometimes considered a healthier alternative to ice cream because of the lower fat content, as well as lower calories per serving. Generally, ice cream contains more fat than sherbet. Per 100-gram serving, the amount of fats in ice cream is 11 grams, while only 2 grams in sherbet. Moreover, as mentioned above, the glycemic index for ice cream is higher than that of sherbet, which means ice cream is absorbed faster, causing a spike in blood sugar levels.
On the other hand, the sugar content of sherbets (24.32g) is slightly higher compared to ice cream (21.22g). This is also the case for carbohydrates since sherbet contains more carbs (30.4g per 100g) than ice cream (23.6g per 100g).
Hence, for individuals who have diabetes and consider consuming a refreshing dessert, there is no right or wrong answer when it comes to choosing ice cream or sherbet. It is recommended to opt for low-fat and low-sugar varieties for both and consume them in moderation as part of a healthy diet.
References
- https://www.fda.gov/consumers/consumer-updates/food-serving-sizes-have-reality-check
- https://doi.org/10.1016/B978-0-12-384947-2.00385-8
- https://doi.org/10.1186/1471-5945-12-13
- https://www.aafp.org/pubs/afp/issues/2003/0415/p1769.html
- https://www.heart.org/en/healthy-living/healthy-eating/eat-smart/fats/saturated-fats

Infographic
All nutrients comparison - raw data values
| Nutrient | |
|
DV% diff. |
| Saturated fat | 6.79g | 1.16g | 26% |
| Fats | 11g | 2g | 14% |
| Cholesterol | 44mg | 1mg | 14% |
| Vitamin A | 118µg | 12µg | 12% |
| Vitamin B2 | 0.24mg | 0.097mg | 11% |
| Vitamin B12 | 0.39µg | 0.13µg | 11% |
| Phosphorus | 105mg | 40mg | 9% |
| Calcium | 128mg | 54mg | 7% |
| Vitamin B5 | 0.581mg | 0.224mg | 7% |
| Monounsaturated fat | 2.969g | 0.53g | 6% |
| Protein | 3.5g | 1.1g | 5% |
| Calories | 207kcal | 144kcal | 3% |
| Potassium | 199mg | 96mg | 3% |
| Choline | 26mg | 7.7mg | 3% |
| Vitamin C | 0.6mg | 2.3mg | 2% |
| Carbs | 23.6g | 30.4g | 2% |
| Fiber | 0.7g | 1.3g | 2% |
| Zinc | 0.69mg | 0.48mg | 2% |
| Vitamin E | 0.3mg | 0.01mg | 2% |
| Vitamin B6 | 0.048mg | 0.023mg | 2% |
| Polyunsaturated fat | 0.452g | 0.08g | 2% |
| Vitamin D* | 8 IU | 0 IU | 1% |
| Vitamin D | 0.2µg | 0µg | 1% |
| Magnesium | 14mg | 8mg | 1% |
| Iron | 0.09mg | 0.14mg | 1% |
| Copper | 0.023mg | 0.028mg | 1% |
| Sodium | 80mg | 46mg | 1% |
| Selenium | 1.8µg | 1.5µg | 1% |
| Vitamin B1 | 0.041mg | 0.027mg | 1% |
| Protein per 100 calories | 1.7g | 0.76g | N/A |
| Calories per 10 g protein | 591kcal | 1309kcal | N/A |
| Weight per 100 calories | 48g | 69g | N/A |
| Unsaturated / Saturated Fat ratio | 0.5 | 0.53 | N/A |
| Net carbs | 22.9g | 29.1g | N/A |
| Sugar | 21.22g | 24.32g | N/A |
| Manganese | 0.008mg | 0.011mg | 0% |
| Vitamin B3 | 0.116mg | 0.063mg | 0% |
| Vitamin K | 0.3µg | 0µg | 0% |
| Folate | 5µg | 4µg | 0% |
| Tryptophan | 0.045mg | 0% | |
| Threonine | 0.146mg | 0% | |
| Isoleucine | 0.195mg | 0% | |
| Leucine | 0.316mg | 0% | |
| Lysine | 0.258mg | 0% | |
| Methionine | 0.081mg | 0% | |
| Phenylalanine | 0.157mg | 0% | |
| Valine | 0.217mg | 0% | |
| Histidine | 0.088mg | 0% | |
| Omega-3 - EPA | 0.003g | 0g | N/A |
People also compare


References
All the values for which the sources are not specified explicitly are taken from FDA’s Food Central. The exact link to the food presented on this page can be found below.
- Ice cream - https://fdc.nal.usda.gov/fdc-app.html#/food-details/167575/nutrients
- Sherbet - https://fdc.nal.usda.gov/fdc-app.html#/food-details/167577/nutrients
All the Daily Values are presented for males aged 31-50, for 2000-calorie diets.