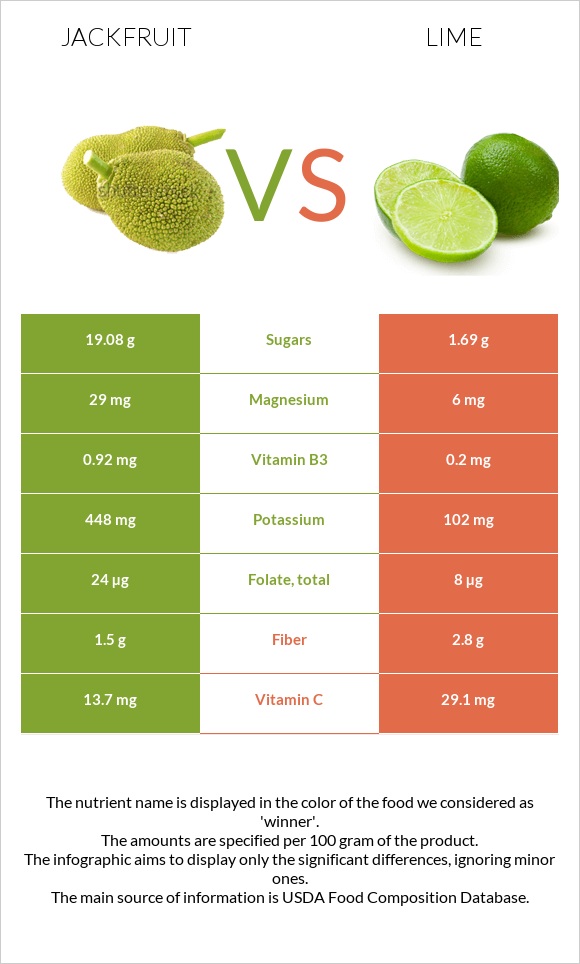
Summary of differences between jackfruit and lime Jackfruit has more vitamin B6, potassium, vitamin B1, and magnesium; however, lime is higher in vitamin C and fiber. Jackfruit covers your daily need for vitamin B6, 22% more than lime. Jackfruit has 11 times more sugar than lime. While jackfruit has 19.08g of sugar, lime has only 1.69g. The glycemic index of jackfruit is higher. These are the specific foods used in this comparison Jackfruit, raw and Limes, raw .
Infographic
Mineral Comparison
Mineral comparison score is based on the number of minerals by which one or the other food is richer. The "coverage" charts below show how much of the daily needs can be covered by 300 grams of the food.
6
100 g
300 g
1 cup 1" pieces - 151g 1 cup, sliced - 165g
Magnesium
Magnesium
Calcium
Calcium
Potassium
Potassium
Iron
Iron
Copper
Copper
Zinc
Zinc
Phosphorus
Phosphorus
Sodium
Sodium
Manganese
Manganese
Selenium
Selenium
21%
7.2%
40%
8.6%
25%
3.5%
9%
0.26%
5.6%
0%
3
100 g
300 g
1 fruit (2" dia) - 67g 1 NLEA serving - 67g
Magnesium
Magnesium
Calcium
Calcium
Potassium
Potassium
Iron
Iron
Copper
Copper
Zinc
Zinc
Phosphorus
Phosphorus
Sodium
Sodium
Manganese
Manganese
Selenium
Selenium
4.3%
9.9%
9%
23%
22%
3%
7.7%
0.26%
1%
2.2%
Vitamin Comparison
Vitamin comparison score is based on the number of vitamins by which one or the other food is richer. The "coverage" charts below show how much of the daily needs can be covered by 300 grams of the food.
7
100 g
300 g
1 cup 1" pieces - 151g 1 cup, sliced - 165g
Vitamin C
Vit. C
Vitamin D
Vit. D
Vitamin A
Vit. A
Vitamin E
Vit. E
Vitamin B1
Vit. B1
Vitamin B2
Vit. B2
Vitamin B3
Vit. B3
Vitamin B5
Vit. B5
Vitamin B6
Vit. B6
Vitamin B12
Vit. B12
Vitamin K
Vit. K
Folate
Folate
46%
0%
1.7%
6.8%
26%
13%
17%
14%
76%
0%
0%
18%
2
100 g
300 g
1 fruit (2" dia) - 67g 1 NLEA serving - 67g
Vitamin C
Vit. C
Vitamin D
Vit. D
Vitamin A
Vit. A
Vitamin E
Vit. E
Vitamin B1
Vit. B1
Vitamin B2
Vit. B2
Vitamin B3
Vit. B3
Vitamin B5
Vit. B5
Vitamin B6
Vit. B6
Vitamin B12
Vit. B12
Vitamin K
Vit. K
Folate
Folate
97%
0%
0.67%
4.4%
7.5%
4.6%
3.8%
13%
9.9%
0%
1.5%
6%
All nutrients comparison - raw data values
Nutrient
DV% diff.
Vitamin B6
0.329mg
0.043mg
22%
Vitamin C
13.7mg
29.1mg
17%
Fructose
9.19g
11%
Potassium
448mg
102mg
10%
Vitamin B1
0.105mg
0.03mg
6%
Magnesium
29mg
6mg
5%
Iron
0.23mg
0.6mg
5%
Fiber
1.5g
2.8g
5%
Vitamin B3
0.92mg
0.2mg
5%
Carbs
23.25g
10.54g
4%
Folate
24µg
8µg
4%
Calories
95kcal
30kcal
3%
Vitamin B2
0.055mg
0.02mg
3%
Protein
1.72g
0.7g
2%
Manganese
0.043mg
0.008mg
2%
Fats
0.64g
0.2g
1%
Calcium
24mg
33mg
1%
Copper
0.076mg
0.065mg
1%
Starch
1.47g
1%
Vitamin E
0.34mg
0.22mg
1%
Selenium
0.4µg
1%
Vitamin K
0.6µg
1%
Choline
5.1mg
1%
Saturated fat
0.195g
0.022g
1%
Protein per 100 calories
1.8g
2.3g
N/A
Calories per 10 g protein
552kcal
429kcal
N/A
Weight per 100 calories
105g
333g
N/A
Net carbs
21.75g
7.74g
N/A
Sugar
19.08g
1.69g
N/A
Zinc
0.13mg
0.11mg
0%
Phosphorus
21mg
18mg
0%
Sodium
2mg
2mg
0%
Vitamin A
5µg
2µg
0%
Vitamin B5
0.235mg
0.217mg
0%
Monounsaturated fat
0.155g
0.019g
0%
Polyunsaturated fat
0.094g
0.055g
0%
Tryptophan
0.034mg
0.003mg
0%
Threonine
0.086mg
0%
Isoleucine
0.069mg
0%
Leucine
0.103mg
0%
Lysine
0.069mg
0.014mg
0%
Methionine
0.034mg
0.002mg
0%
Phenylalanine
0.052mg
0%
Valine
0.086mg
0%
Histidine
0.034mg
0%
Omega-3 - ALA
0.079g
N/A
Omega-6 - Linoleic acid
0.015g
N/A
Macronutrient Comparison
Macronutrient breakdown side-by-side comparison
4
2%
23%
73%
Protein:
1.72 g
Fats:
0.64 g
Carbs:
23.25 g
Water:
73.46 g
Other:
0.93 g
1
11%
88%
Protein:
0.7 g
Fats:
0.2 g
Carbs:
10.54 g
Water:
88.26 g
Other:
0.3 g
Contains
more
Protein Protein
+145.7%
Contains
more
Fats Fats
+220%
Contains
more
Carbs Carbs
+120.6%
Contains
more
Other Other
+210%
Contains
more
Water Water
+20.1%
Fat Type Comparison
Fat type breakdown side-by-side comparison
2
44%
35%
21%
Saturated fat:
Sat. Fat
0.195 g
Monounsaturated fat:
Mono. Fat
0.155 g
Polyunsaturated fat:
Poly. Fat
0.094 g
1
23%
20%
57%
Saturated fat:
Sat. Fat
0.022 g
Monounsaturated fat:
Mono. Fat
0.019 g
Polyunsaturated fat:
Poly. Fat
0.055 g
Contains
more
Mono. Fat Monounsaturated fat
+715.8%
Contains
more
Poly. Fat Polyunsaturated fat
+70.9%
Contains
less
Sat. Fat Saturated fat
-88.7%