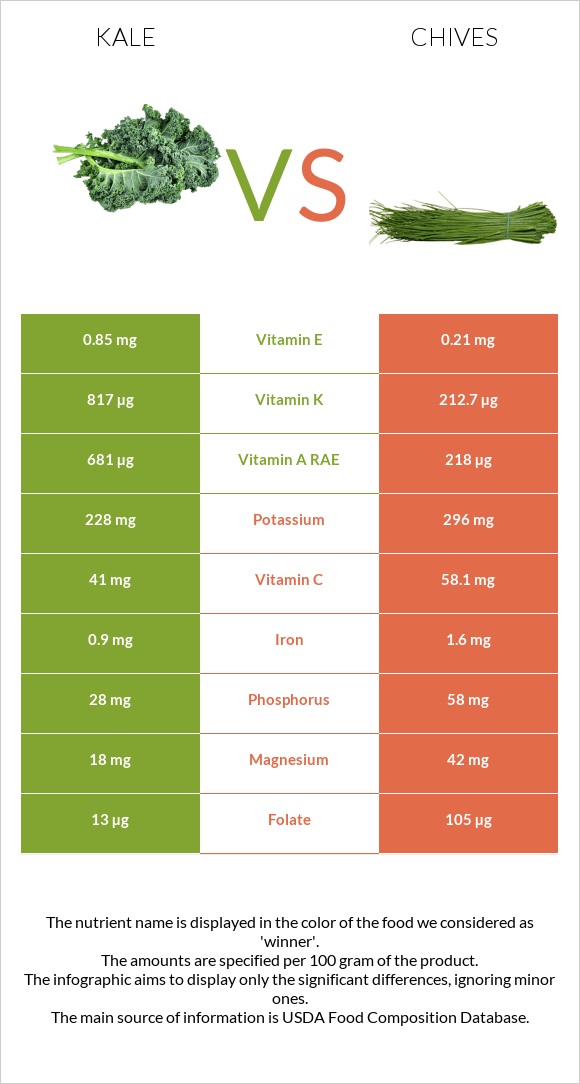
Significant differences between kale and chives Kale has more vitamin K and vitamin A; however, chives are richer in folate, vitamin C, iron, magnesium, and vitamin B5. Kale covers your daily vitamin K needs 504% more than chives. Chives have 4 times less vitamin E than kale. Kale has 0.85mg of vitamin E, while chives have 0.21mg. Specific food types used in this comparison are Kale, cooked, boiled, drained, without salt and Chives, raw .
Infographic
Mineral Comparison
Mineral comparison score is based on the number of minerals by which one or the other food is richer. The "coverage" charts below show how much of the daily needs can be covered by 300 grams of the food.
1
100 g
300 g
1 cup, chopped - 130g
Magnesium
Magnesium
Calcium
Calcium
Potassium
Potassium
Iron
Iron
Copper
Copper
Zinc
Zinc
Phosphorus
Phosphorus
Sodium
Sodium
Manganese
Manganese
Selenium
Selenium
13%
22%
20%
34%
52%
6.5%
12%
3%
54%
4.9%
7
100 g
300 g
1 tsp chopped - 1g 1 tbsp chopped - 3g
Magnesium
Magnesium
Calcium
Calcium
Potassium
Potassium
Iron
Iron
Copper
Copper
Zinc
Zinc
Phosphorus
Phosphorus
Sodium
Sodium
Manganese
Manganese
Selenium
Selenium
30%
28%
26%
60%
52%
15%
25%
0.39%
49%
4.9%
Vitamin Comparison
Vitamin comparison score is based on the number of vitamins by which one or the other food is richer. The "coverage" charts below show how much of the daily needs can be covered by 300 grams of the food.
3
100 g
300 g
1 cup, chopped - 130g
Vitamin C
Vit. C
Vitamin D
Vit. D
Vitamin A
Vit. A
Vitamin E
Vit. E
Vitamin B1
Vit. B1
Vitamin B2
Vit. B2
Vitamin B3
Vit. B3
Vitamin B5
Vit. B5
Vitamin B6
Vit. B6
Vitamin B12
Vit. B12
Vitamin K
Vit. K
Folate
Folate
137%
0%
227%
17%
13%
16%
9.4%
2.9%
32%
0%
2043%
9.8%
6
100 g
300 g
1 tsp chopped - 1g 1 tbsp chopped - 3g
Vitamin C
Vit. C
Vitamin D
Vit. D
Vitamin A
Vit. A
Vitamin E
Vit. E
Vitamin B1
Vit. B1
Vitamin B2
Vit. B2
Vitamin B3
Vit. B3
Vitamin B5
Vit. B5
Vitamin B6
Vit. B6
Vitamin B12
Vit. B12
Vitamin K
Vit. K
Folate
Folate
194%
0%
73%
4.2%
20%
27%
12%
19%
32%
0%
532%
79%
All nutrients comparison - raw data values
Nutrient
DV% diff.
Vitamin K
817µg
212.7µg
504%
Vitamin A
681µg
218µg
51%
Folate
13µg
105µg
23%
Vitamin C
41mg
58.1mg
19%
Iron
0.9mg
1.6mg
9%
Magnesium
18mg
42mg
6%
Vitamin B5
0.049mg
0.324mg
6%
Phosphorus
28mg
58mg
4%
Vitamin E
0.85mg
0.21mg
4%
Protein
1.9g
3.27g
3%
Zinc
0.24mg
0.56mg
3%
Vitamin B2
0.07mg
0.115mg
3%
Calcium
72mg
92mg
2%
Potassium
228mg
296mg
2%
Fiber
2g
2.5g
2%
Manganese
0.416mg
0.373mg
2%
Vitamin B1
0.053mg
0.078mg
2%
Fats
0.4g
0.73g
1%
Sodium
23mg
3mg
1%
Vitamin B3
0.5mg
0.647mg
1%
Choline
0.4mg
5.2mg
1%
Calories
28kcal
30kcal
0%
Protein per 100 calories
6.8g
11g
N/A
Calories per 10 g protein
147kcal
92kcal
N/A
Weight per 100 calories
357g
333g
N/A
Net carbs
3.63g
1.85g
N/A
Carbs
5.63g
4.35g
0%
Sugar
1.25g
1.85g
N/A
Copper
0.156mg
0.157mg
0%
Selenium
0.9µg
0.9µg
0%
Vitamin B6
0.138mg
0.138mg
0%
Saturated fat
0.052g
0.146g
0%
Monounsaturated fat
0.03g
0.095g
0%
Polyunsaturated fat
0.193g
0.267g
0%
Tryptophan
0.023mg
0.037mg
0%
Threonine
0.085mg
0.128mg
0%
Isoleucine
0.114mg
0.139mg
0%
Leucine
0.133mg
0.195mg
0%
Lysine
0.114mg
0.163mg
0%
Methionine
0.018mg
0.036mg
0%
Phenylalanine
0.097mg
0.105mg
0%
Valine
0.104mg
0.145mg
0%
Histidine
0.04mg
0.057mg
0%
Macronutrient Comparison
Macronutrient breakdown side-by-side comparison
2
2%
6%
91%
Protein:
1.9 g
Fats:
0.4 g
Carbs:
5.63 g
Water:
91.2 g
Other:
0.87 g
3
3%
4%
91%
Protein:
3.27 g
Fats:
0.73 g
Carbs:
4.35 g
Water:
90.65 g
Other:
1 g
Contains
more
Carbs Carbs
+29.4%
Contains
more
Protein Protein
+72.1%
Contains
more
Fats Fats
+82.5%
Contains
more
Other Other
+14.9%
Fat Type Comparison
Fat type breakdown side-by-side comparison
1
19%
11%
70%
Saturated fat:
Sat. Fat
0.052 g
Monounsaturated fat:
Mono. Fat
0.03 g
Polyunsaturated fat:
Poly. Fat
0.193 g
2
29%
19%
53%
Saturated fat:
Sat. Fat
0.146 g
Monounsaturated fat:
Mono. Fat
0.095 g
Polyunsaturated fat:
Poly. Fat
0.267 g
Contains
less
Sat. Fat Saturated fat
-64.4%
Contains
more
Mono. Fat Monounsaturated fat
+216.7%
Contains
more
Poly. Fat Polyunsaturated fat
+38.3%