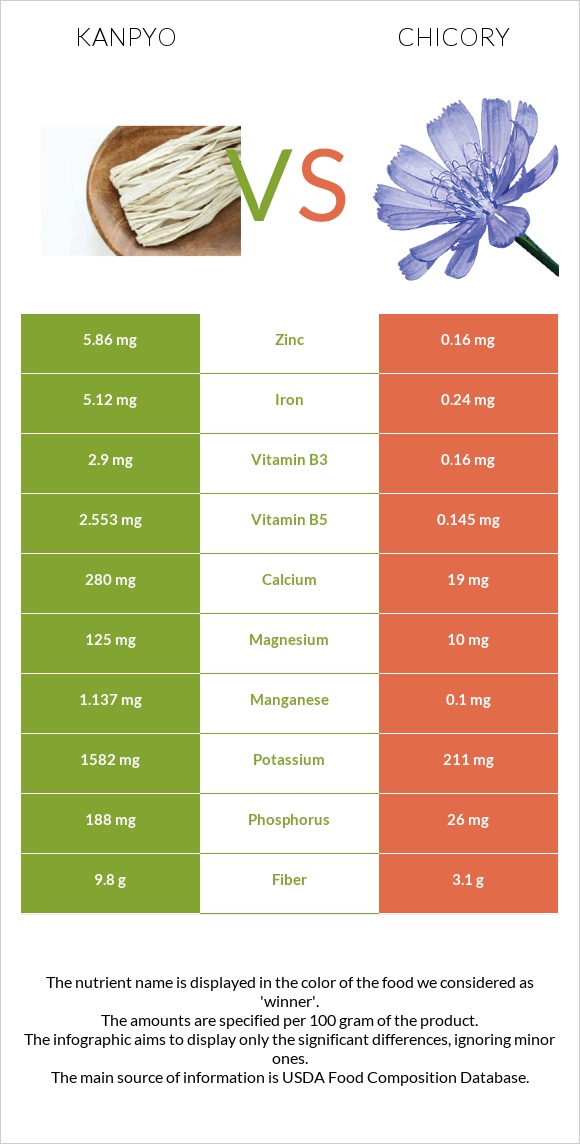
How are kanpyo and chicory different? Kanpyo is higher than chicory in iron, zinc, vitamin B5, manganese, copper, potassium, vitamin B6, magnesium, fiber, and calcium. Kanpyo covers your daily need for iron, 61% more than chicory. Kanpyo contains 37 times more zinc than chicory. Kanpyo contains 5.86mg of zinc, while chicory contains 0.16mg. Kanpyo, (dried gourd strips) and Chicory, witloof, raw types were used in this article.
Infographic
Mineral Comparison
Mineral comparison score is based on the number of minerals by which one or the other food is richer. The "coverage" charts below show how much of the daily needs can be covered by 300 grams of the food.
9
100 g
300 g
1 strip - 6.3g 0.5 cup - 27g
Magnesium
Magnesium
Calcium
Calcium
Potassium
Potassium
Iron
Iron
Copper
Copper
Zinc
Zinc
Phosphorus
Phosphorus
Sodium
Sodium
Manganese
Manganese
Selenium
Selenium
89%
84%
140%
192%
144%
160%
81%
2%
148%
14%
1
100 g
300 g
0.5 cup - 45g 1 head - 53g
Magnesium
Magnesium
Calcium
Calcium
Potassium
Potassium
Iron
Iron
Copper
Copper
Zinc
Zinc
Phosphorus
Phosphorus
Sodium
Sodium
Manganese
Manganese
Selenium
Selenium
7.1%
5.7%
19%
9%
17%
4.4%
11%
0.26%
13%
1.1%
Vitamin Comparison
Vitamin comparison score is based on the number of vitamins by which one or the other food is richer. The "coverage" charts below show how much of the daily needs can be covered by 300 grams of the food.
5
100 g
300 g
1 strip - 6.3g 0.5 cup - 27g
Vitamin C
Vit. C
Vitamin D
Vit. D
Vitamin A
Vit. A
Vitamin E
Vit. E
Vitamin B1
Vit. B1
Vitamin B2
Vit. B2
Vitamin B3
Vit. B3
Vitamin B5
Vit. B5
Vitamin B6
Vit. B6
Vitamin B12
Vit. B12
Vitamin K
Vit. K
Folate
Folate
0.67%
0%
0%
0%
0%
10%
54%
153%
123%
0%
0%
46%
3
100 g
300 g
0.5 cup - 45g 1 head - 53g
Vitamin C
Vit. C
Vitamin D
Vit. D
Vitamin A
Vit. A
Vitamin E
Vit. E
Vitamin B1
Vit. B1
Vitamin B2
Vit. B2
Vitamin B3
Vit. B3
Vitamin B5
Vit. B5
Vitamin B6
Vit. B6
Vitamin B12
Vit. B12
Vitamin K
Vit. K
Folate
Folate
9.3%
0%
0.33%
0%
16%
6.2%
3%
8.7%
9.7%
0%
0%
28%
All nutrients comparison - raw data values
Nutrient
DV% diff.
Iron
5.12mg
0.24mg
61%
Zinc
5.86mg
0.16mg
52%
Vitamin B5
2.553mg
0.145mg
48%
Manganese
1.137mg
0.1mg
45%
Copper
0.433mg
0.051mg
42%
Potassium
1582mg
211mg
40%
Vitamin B6
0.532mg
0.042mg
38%
Magnesium
125mg
10mg
27%
Fiber
9.8g
3.1g
27%
Calcium
280mg
19mg
26%
Phosphorus
188mg
26mg
23%
Carbs
65.03g
4g
20%
Vitamin B3
2.9mg
0.16mg
17%
Protein
8.58g
0.9g
15%
Calories
258kcal
17kcal
12%
Folate
61µg
37µg
6%
Vitamin B1
0mg
0.062mg
5%
Selenium
2.6µg
0.2µg
4%
Vitamin C
0.2mg
2.8mg
3%
Fats
0.56g
0.1g
1%
Sodium
15mg
2mg
1%
Vitamin B2
0.044mg
0.027mg
1%
Polyunsaturated fat
0.244g
0.044g
1%
Protein per 100 calories
3.3g
5.3g
N/A
Calories per 10 g protein
301kcal
189kcal
N/A
Weight per 100 calories
39g
588g
N/A
Net carbs
55.23g
0.9g
N/A
Vitamin A
1µg
0%
Saturated fat
0.045g
0.024g
0%
Monounsaturated fat
0.103g
0.002g
0%
Tryptophan
0.016mg
0%
Threonine
0.025mg
0%
Isoleucine
0.054mg
0%
Leucine
0.039mg
0%
Lysine
0.035mg
0%
Methionine
0.005mg
0%
Phenylalanine
0.022mg
0%
Valine
0.041mg
0%
Histidine
0.015mg
0%
Macronutrient Comparison
Macronutrient breakdown side-by-side comparison
4
9%
65%
20%
6%
Protein:
8.58 g
Fats:
0.56 g
Carbs:
65.03 g
Water:
19.97 g
Other:
5.86 g
1
4%
95%
Protein:
0.9 g
Fats:
0.1 g
Carbs:
4 g
Water:
94.52 g
Other:
0.48 g
Contains
more
Protein Protein
+853.3%
Contains
more
Fats Fats
+460%
Contains
more
Carbs Carbs
+1525.8%
Contains
more
Other Other
+1120.8%
Contains
more
Water Water
+373.3%
Fat Type Comparison
Fat type breakdown side-by-side comparison
2
11%
26%
62%
Saturated fat:
Sat. Fat
0.045 g
Monounsaturated fat:
Mono. Fat
0.103 g
Polyunsaturated fat:
Poly. Fat
0.244 g
1
34%
3%
63%
Saturated fat:
Sat. Fat
0.024 g
Monounsaturated fat:
Mono. Fat
0.002 g
Polyunsaturated fat:
Poly. Fat
0.044 g
Contains
more
Mono. Fat Monounsaturated fat
+5050%
Contains
more
Poly. Fat Polyunsaturated fat
+454.5%
Contains
less
Sat. Fat Saturated fat
-46.7%